Spectroradiometers are excellent tools for measuring the brightness (luminance) and color (chromaticity) of an illuminated display or light source at a single point. Imaging colorimeters are similarly powerful tools for measuring light and color using images for spatial context.
Each of these LMDs (light measurement devices) measures color in a variety of ways and captures a diverse subset of data that relates to the visual characteristics of a device under test (DUT).
For conclusive assessment of performance and quality with regards to lighting and display products, from the lab through to complete assembly, developers and manufacturers often require a complete set of data that incorporates both spectral and colorimetric characteristics.

Examples of products and devices that require luminance and chromaticity measurement in development and manufacturing. Image Credit: Radiant Vision Systems
Numerous inspection applications necessitate the capacities of both a spectroradiometer and an imaging colorimeter for device qualification. This means that manufacturers are typically required to source and purchase both systems.
But only one LMD can be applied at a time for measurement, necessitating numerous stations or processes - an laborious and expensive approach. Moreover, any manual setup and data transfer between systems can result in periods of significant downtime or cause errors to occur at various stages of the inspection process.
Combining the two measurement devices into a single system provides developers and manufacturers with a more durable, multi-functional, precise, and effective metrology solution.
To comprehend these two types of LMDs, how they each determine light and color, their capabilities that complement one another, and the significance of both spectral and colorimetric data for evaluating device performance, an overview of the light and color spectrum is needed.
The Light & Color Spectrum
The electromagnetic spectrum represents all of the light energy that radiates from the sun - and indeed, all of the light energy passing through the universe, both visible and invisible to the human eye.
One way to determine what kind of light is present is by measuring its wavelength. Light waves are comprised of sub-atomic particles known as photons, which oscillate at various frequencies. The larger the frequency, the smaller the wavelength.
The full spectrum ranges from extremely energetic gamma rays at one end (short wavelength) right down to low-energy microwaves and radio waves on the other end (long wavelength).
The really small band at the center of the spectrum is the range of visible light that the human eye can detect. Visible light has wavelengths that range from around 380 nanometers (nm) to 700 nm, bookended by ultraviolet (UV) at the low end of the range and infrared (IR) at the high end.
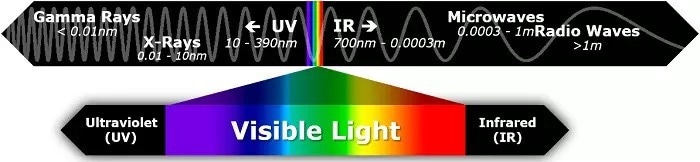
The electromagnetic spectrum from high-energy, high-frequency, short-wavelength gamma rays to low-energy, low-frequency, long-wavelength radio waves. The visible light spectrum - the range of wavelengths that can be perceived by the human eye - is just a small sliver of the electromagnetic spectrum, extending from roughly 380 nm – 700 nm. Image Credit: Radiant Vision Systems
Radiometry, Spectrometry, and Spectroradiometry
Radiometry is the science of measuring wavelengths of light across the spectrum, including those outside the range of human visual perception.
Using radiometers, users are able to determine the energy emitted by a particular wavelength range, for instance, UV or IR. They are generally inexpensive, portable, and can take rapid measurements of a light source’s total power or radiant flux (measured in Watts).
Spectrometers are also commonly utilized for measuring wavelength ranges but are applied to measure the composition of light with the use of internal optical diffraction gratings, prisms, or filters to split light into its component wavelengths.
While extremely precise, spectrometers are not catchall systems as they must be coupled with additional optics to output relevant measurement values.
Pairing a spectrometer and radiometer produces what is known as a spectroradiometer, which utilizes the high-precision of the spectrometer to measure different characteristics of light sources such as radiance, luminance, and chromaticity values.
A spectroradiometer can be used to measure spectral values alone or utilized as a reference instrument to offer very precise data for the calibration of other measurement instruments such as imagers.
One downside of using all three of these LMDs is that they only have the capacity to measure a limited area or “spot” – generically, they are known as “spot meters.” This means that they lack the ability to measure a complete display panel or the whole distribution of a light source simultaneously. Instead, several individual measurements must be used to capture all relevant light output.
Imaging Photometers and Colorimeters
Photometry is concerned with the science of measuring wavelengths of light relative to how the human eye perceives them; colorimetry uses the same principles to measure wavelengths predicated on how we discern color.
Compared with the spot meters detailed above, imaging photometer and colorimeter instruments have the ability to capture and measure a complete area simultaneously in a single image – this can then be analyzed for several parameters at the same time.
Imaging photometers have both luminance values and spatial resolution measurement capacities; colorimeters measure these properties in addition to chromaticity. These LMD systems facilitate advanced image processing techniques, including defect detection and display mura analysis, which are necessary for comparing measurement values across a DUT to evaluate uniformity.
Spectral and Colorimetric Measurement
There is, however, a significant difference between spectral and photometric/colorimetric measurements.
Spectral data, as measured by a spectroradiometer, is able to capture absolute values: the raw energy of each respective wavelength of a light source. Photometric/colorimetric measurements, on the other hand, characterize a light source relative to the perceptive facilities of the human eye. This data captures how much energy per wavelength is perceived by a standard human observer.
Spectral data can be used to generate a spectral power distribution (SPD): a graphical image that represents the energy and wavelength properties of the source, as displayed in the images below. The y-axis is generally not normalized against absolute unit measurements but instead on a scale from 0 -1, signifying relative power at each wavelength.
Colorimetric data can be applied to symbolize the human visual system’s response to a light source’s SPD, which is usually perceived as a single “color.” The reality is that the color observed is based on how the cones (structures in the human eye) respond to three primaries - typically, red, green, and blue, as displayed in the image below.
For an in-depth explanation of SPDs and the human visual response, watch a webinar from the Photonics Spectra Conference online, “Colorimetry: A Primer on the Science of Light and Color Measurement.”
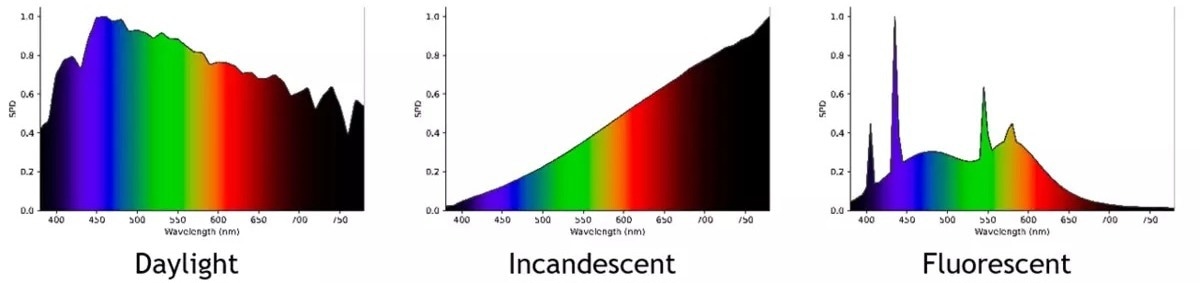
Spectral power distributions of three example light sources: the sun at full daylight, a typical incandescent bulb, and a typical fluorescent bulb. Wavelength is shown on the x-axis, and relative intensity (power) is shown on the y-axis. (Image source: Luminus Devices, Inc.)
There are a number of uses for SPDs and spectral data in engineering, industrial, scientific, and commercial applications. For instance, LED manufacturers and lighting designers use SPDs to help generate lighting schemes that are optimized for human activity and comfort (human-centric lighting).
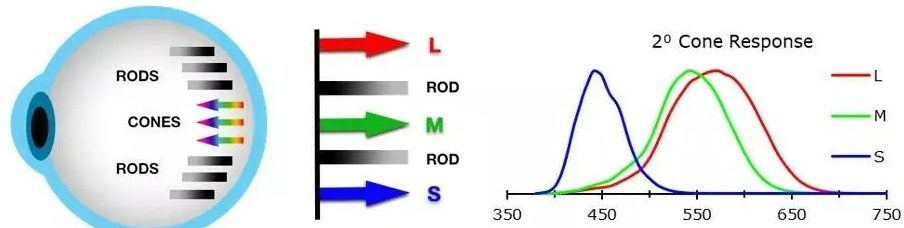
The human eye has three types of cones (S, M, and L) that are each sensitive to a range of wavelengths of light roughly corresponding to red, green, and blue. The combined response of our 3 cones enables us to perceive the “color” of an SPD at a given power per wavelength. Image Credit: Radiant Vision Systems
Colorimetric data is especially useful in the evaluation of manufactured products - such as light sources, painted surfaces, printed materials, and illuminated displays that will be seen and used by humans. In such instances, absolute color specifications are not as important as how the color appears to customers.
Calibration Ensures Accuracy
Light and color data is only as good as it is accurate. Any measurement device or piece of metrology equipment must be calibrated to a known standard to make sure that accurate results are acquired.
For instance, Radiant’s measurement systems are factory calibrated, and again at installation, and it is recommended that annual recalibration is conducted to ensure consistency in performance.
But in some applications, it is necessary to apply more frequent calibration, for instance, if various types or colors of DUTs are being tested.
When making use of an imaging colorimeter, absolute values from a spectrometer or spectroradiometer are required to reset the colorimeter’s response for each new scenario. Using a spectroradiometer device to conduct frequent manual calibrations in these scenarios could be a labor-intensive and time-consuming process.
An imaging colorimeter with a built-in spectrometer that offers quick, automatic calibration eradicates these challenges. Device makers can rest assured that they will have an efficient, precise measurement of the complete data set required.
An Integrated Imaging Colorimeter + Spectroradiometer Solution
Radiant’s new ProMetric® I-SC is the integrated solution that meets such requirements, as it pairs a high-resolution ProMetric I Imaging Colorimeter for fast visual inspection with a high-end spectroradiometer for color calibration and spectral data measurements in real-time.
This sophisticated design is based on patented technology that Radiant Vision Systems has developed in-house (US Patent No. 8482652).
Applying a measurement image obtained using the connected imaging colorimeter, the ProMetric I-SC measures spectral data at the center point of a DUT simultaneously while comparing and quantifying spatial luminance (cd/m2) and chromaticity (CIE x,y and u′v′) values across the image to assess a device.
Both systems can be managed using a single software platform, Radiant’s TrueTest™ Software, which also offers a centralized interface for data visualization and output.
When used in combination with TrueTest™, the ProMetric I-SC system is able to capture both spectral data and precise, repeatable color measurement across devices and testing environments. Other benefits include the ability to:
- Capture and store repeatable, CIE-matched measurements
- Choose from multiple sensor resolution options and lens choices with Smart Calibration™ for a wide range of distance and aperture settings
- Preserve continuous operation, including fully automated data capture and system calibration
- Simultaneously capture spectral and spatial measurement data using a single solution
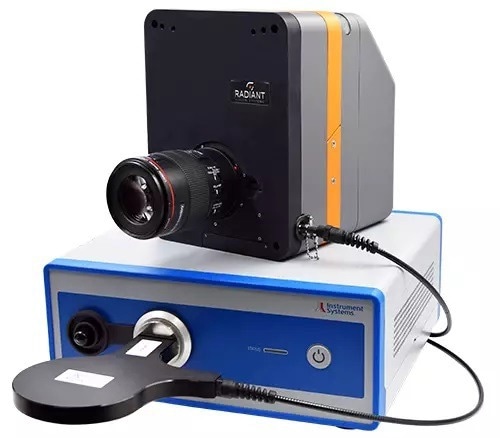
Radiant’s ProMetric® I-SC integrates a ProMetric Imaging Colorimeter with a high-end spectroradiometer. Image Credit: Radiant Vision Systems
With the ProMetric I-SC, Radiant’s single system delivers the benefits of both systems’ capabilities in a single solution, lifting the burden of purchasing several systems or learning separate platforms.
Direct integration also facilitates automatic system functionality without the need for user intervention. Users can measure spectral and spatial data at a distinct point on a source, monitor output, and apply color calibrations directly without having to move equipment.
Combining the capabilities of each system in the ProMetric I-SC also optimizes the capabilities of the complete solution. Through the context of measurement images, users are able to determine and view the exact position of the spectrometer’s spectral measurement point as a spot in the image (not feasible when using a spectrometer separate from an imaging system).
Similarly, as the spectroradiometer utilizes the imaging colorimeter’s optics, it can obtain spectral data from the precise position and angle relative to the DUT that the imager captures.
From complete accuracy in product design to optimized efficiency for in-line quality control, the ProMetric I-SC Solution is specifically engineered to handle all end-to-end metrology applications.

This information has been sourced, reviewed and adapted from materials provided by Konica Minolta Sensing Americas.
For more information on this source, please visit Konica Minolta Sensing Americas.