One of the biggest growth areas in the automotive market is head-up display (HUD) technology. It has a key focus on increased passenger safety via enhanced vehicle operations and operator awareness.
HUD technology has a compound annual growth rate (CAGR) of 21.67%, and according to research, is expected to achieve a market size of USD 1.33 Billion by 2021.1 This growth is largely due to advances in display technology which permit the projection of light onto an infinite plane.
This includes advances in augmented reality (AR) applications, where to display relevant and timely driving condition information, virtual images are superimposed onto real-world environments.
Visual performance is vital to the function of HUD systems, as with any display. Accurate system design and final inspection for quality control ensure that light and colors are vivid enough to be clearly discernible from surroundings in any lighting condition, and that projections are aligned correctly and clear for in-focus binocular viewing.
Low-quality projections harm a manufacturer’s brand reputation, but ultimately, they put passengers at risk if observers cannot interpret poorly projected objects in the viewing area of the display. This can result in misinterpretation, loss of critical environmental data (such as object proximity, navigation, and other alerts), and driver distraction.
Automotive standards for HUD performance have been determined to ensure that manufacturers evaluate HUDs to baseline thresholds for safety and quality, as poor-quality systems pose a huge risk to consumers.
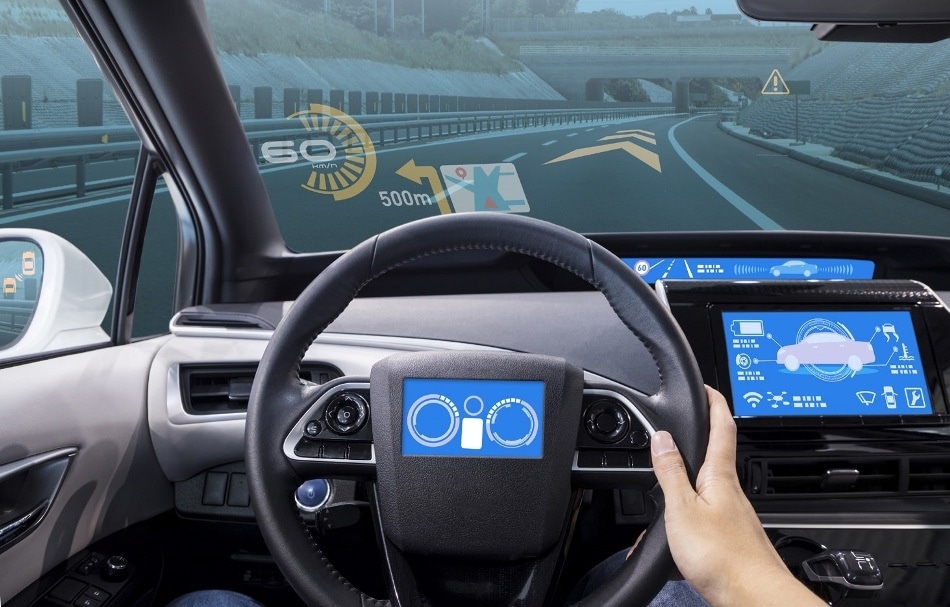
Figure 1. As with AR displays, HUD projections must be visible at precise locations projected onto an infinite plane. Ensuring correct position, color, brightness, and clarity of HUD images augments the operator experience and limits error that may cause distraction.
The two standards in the U.S. which outline baseline quality measurement criteria for automotive HUDs are SAE J1757-1 (“Standard Methodology for Vehicular Displays”)2 and ISO 15008 (“Road vehicles – Ergonomic aspects of transport information and control systems – Specifications and test procedures for in-vehicle visual presentation”).3
Display test and light measurement systems are quality control solutions which provide an effective means of ensuring compliance with these standards, but variations in geometries and system performance may result in discrepancies in quality from one manufacturer to the next.
A new standard was published in the summer of 2017 for this reason, to control the measurement systems which are utilized to evaluate HUD quality further.
This article introduces the requirements of the new SAE J1757-2 standard4 and outlines the approved techniques for HUD measurement supporting ISO and SAE quality compliance. The paper also emphasizes the advantages of automated system features to acquire the best cost and time-efficiency in measurement applications.
SAE J1757-2 Standard for Optical Metrology of Automotive HUDs
The safety implications of HUD quality have motivated manufacturers of automotive test and measurement equipment to partner with the Society of Automotive Engineers (SAE) Committee in order to establish standard measurement criteria to evaluate the quality of HUDs in accordance to standards SAE J1757-1 and ISO 15008.
Published in November 2018, the new standard (SAE J1757-2 “Optical System HUD for Automotive”), supplies a technique for optical measurement geometries and requirements for measuring vehicle HUDs, including AR-HUD (augmented reality head-up display) performance.
Standardized test methods will ensure accurate projections of virtual images relative to an operator’s eye (including field of view (FOV), depth of field (DOF), diopter, image location, focus, and image distance).
They will also ensure the legibility of HUD virtual images in typical ambient light illumination (requiring chromaticity, luminance, contrast, and uniformity testing), and HUD image aberration, distortion, or ghosting measured by point deviation from a target virtual image.
An optical measurement device or meter calibrated per NIST/National Lab requirements is needed for these measurements, which is to be located at multiple measuring points within the operator’s eye ellipse area (to account for the scope of potential viewing angles).
All automotive HUD brands and manufacturers must comply with SAE J1757-1 and ISO 15008 must define their measurement system based on the new SAE J1757- 2 HUD measurement standard.
There are several differentiating features among available SAE-compliant systems, which allow differing levels of flexibility to enhance application and setup, although no single measurement system is specified.
Advanced imaging systems which provide automated measurement features are beneficial in decreasing measurement difficulty and time, optimizing quality control and design processes for faster time to market and decreased investment of resources.
Automated systems are particularly useful in HUD measurement, as several measurements of each feature must be recorded for total SAE compliance.
SAE-Compliant HUD Measurement Systems
Current Methods
Spot Meters
A spot meter quantifies light reflected or emitted from only one small spot within a large area. Spot meters supply highly accurate chromaticity and luminance measurements, but they cannot give evaluations of contrast, uniformity, or luminance & chromaticity across an entire display in a single measurement, as their measurement regions of interest are so small.
Spot meters are unable to provide evaluations of uniformity, contrast, or luminance & chromaticity across an entire display in a single measurement.
Manufacturers employing spot meters for automated display measurement must utilize additional equipment to account for this, like an actuator or robotic arm which can position the spot meter at each measurement point in an XYZ space.
The spot meter then captures chromaticity and luminance data at each point and compares this data to interpret contrast, uniformity, and other measurements over the entire display.
This is an acceptable solution for HUD measurement, but the complexity and cost of the equipment that is needed for automated measurements (i.e., on the production line) is not ideal.
Machine vision cameras are twodimensional imaging solutions that locate and measure images in a display using contrasting areas of connected pixels.
SAE J1757-2 also calls for an evaluation of the distance, location, and visual integrity of projected objects within a HUD’s infinite plane, in addition to uniformity and light value measurements.
Spot meters do not capture two-dimensional images, and so cannot analyze the size, scope, or shape of a projected object based on the total area of the pixels that it is made up of.
Spot meters cannot characterize projected objects accurately, or quantify total contrast, uniformity, or deviation from a target image in terms of distortion, skew, or ghosting because of this. Further equipment must be used in order to supplement the spot meter to capture all the measurements required.
Machine Vision Cameras
Machine vision cameras are two-dimensional imaging solutions which locate and measure images in a display via contrasting areas (or blobs) of connected pixels. They can be utilized to supplement spot meters to supply measurements that spot meters alone cannot achieve.
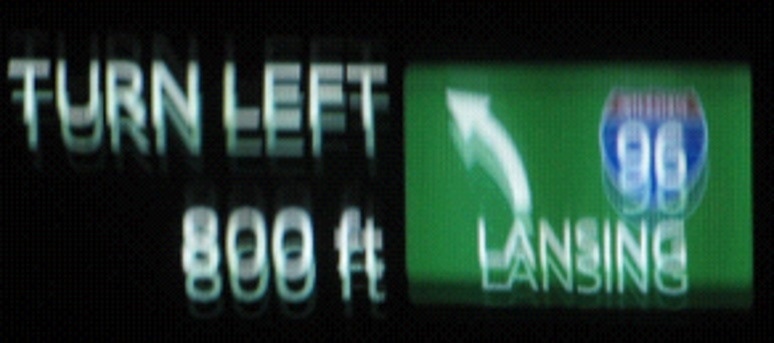
These measurements include the evaluation of an object’s distortion, size, shape, ghosting, or other characteristics which are based on pixel count or pixel blob location (such as optical character verification (OCV) of text). A machine vision camera alone cannot carry out the full range of HUD measurement tasks.
A solution which integrates a machine vision camera and spot meter marries the light measurement capability of the spot meter with the distance, position, and gauging capabilities of machine vision for a total HUD evaluation.
Humans
There are several reasons why humans still play a role in the HUD measurement process, mainly for measurement verification. Humans can make very quick ascertainments of display quality, assessing a full display at a glance, while applying context (rather than specific light values) to establish acceptability.
In contrast, spot meters must gather up to nine measurement points in a display image to compare color, brightness, or other features of measured light values, making these solutions time-consuming for setup, execution, and analysis.
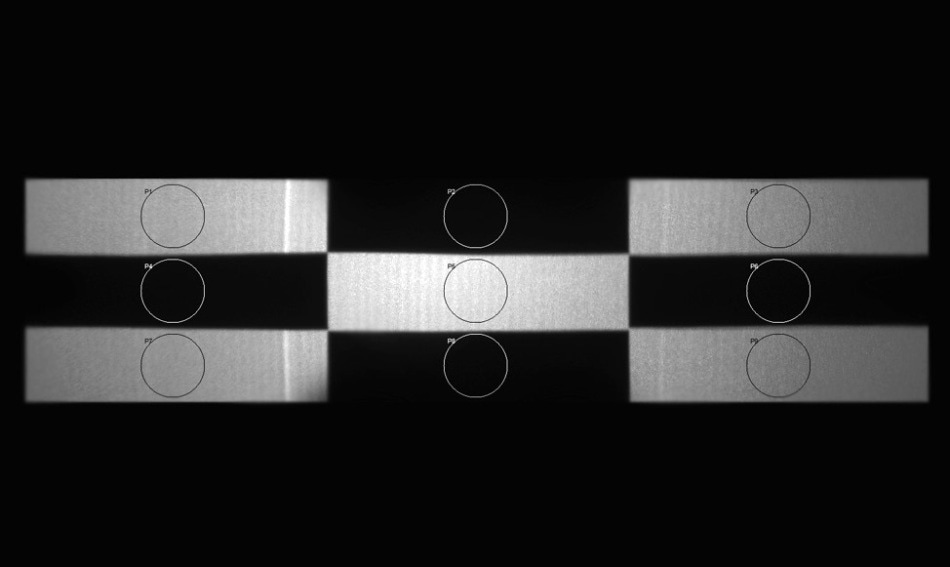
Figure 2. A checkerboard test pattern projected by a HUD system is analyzed by light measurement software to calculate the contrast ratio by dividing the average white values with average black values. A human inspector, however, may not need to perform a calculation to make a quality determination.
The evaluation of the contrast of projected images in a HUD is one area where human speed is advantageous for HUD measurement. This evaluation is carried out by comparing the light and dark areas of black and white images projected by the HUD system.

The majority of HUD measurements specified by SAE standards cannot be adequately performed by human inspectors because quantifiable data is needed to assess measurement accuracy.
The human inspector can establish, without performing a calculation, by either comparing a series of baseline digital measurements or a subjective assessment of the image, whether image contrast is acceptable.
As with any human inspection, the drawback of this technique is the lack of quantifiable measurement data. This lack of data hinders the precision and repeatability of the measurements being carried out and stops an automated implementation of HUD analysis for continuous production-level evaluation.
Furthermore, because quantifiable data is required to assess measurement accuracy, most HUD measurements specified by SAE standards cannot be adequately performed by human inspectors.
Humans may be able to assess some aspects of HUD quality where quantifiable measurements are not needed, but a mechanical system would still be required to supply a complete solution which can address the remaining measurement criteria needed for compliance with SAE.
Automated Alternatives
Imaging Colorimeters and Photometers
As referenced in the SAE J1757-2 standard as a primary solution for HUD testing, imaging photometers and colorimeters supply automated visual inspection using optical components calibrated to NIST (National Institute of Standards and Technology) standards.
Combining the capabilities of a machine vision camera for image acquisition and inspection and a spot meter for light measurement, these systems give absolute measurements of chromaticity, luminance, and contrast, plus object presence, location, shape, size, and distance.
Compared to alternative systems, photometric imaging solutions provide several benefits in HUD measurement applications. These automated technologies allow automotive suppliers and manufacturers to implement SAE Standard measurement practices for HUD quality with little effort and setup time while maintaining accurate measurement data.
Comparing HUD Measurement Setups in Production
It is useful to visualize the equipment setup for SAE J1757-2 Standard HUD measurement to fully understand the efficiency of an automated HUD measurement system. The below images show the difference between two production-level measurement integrations.
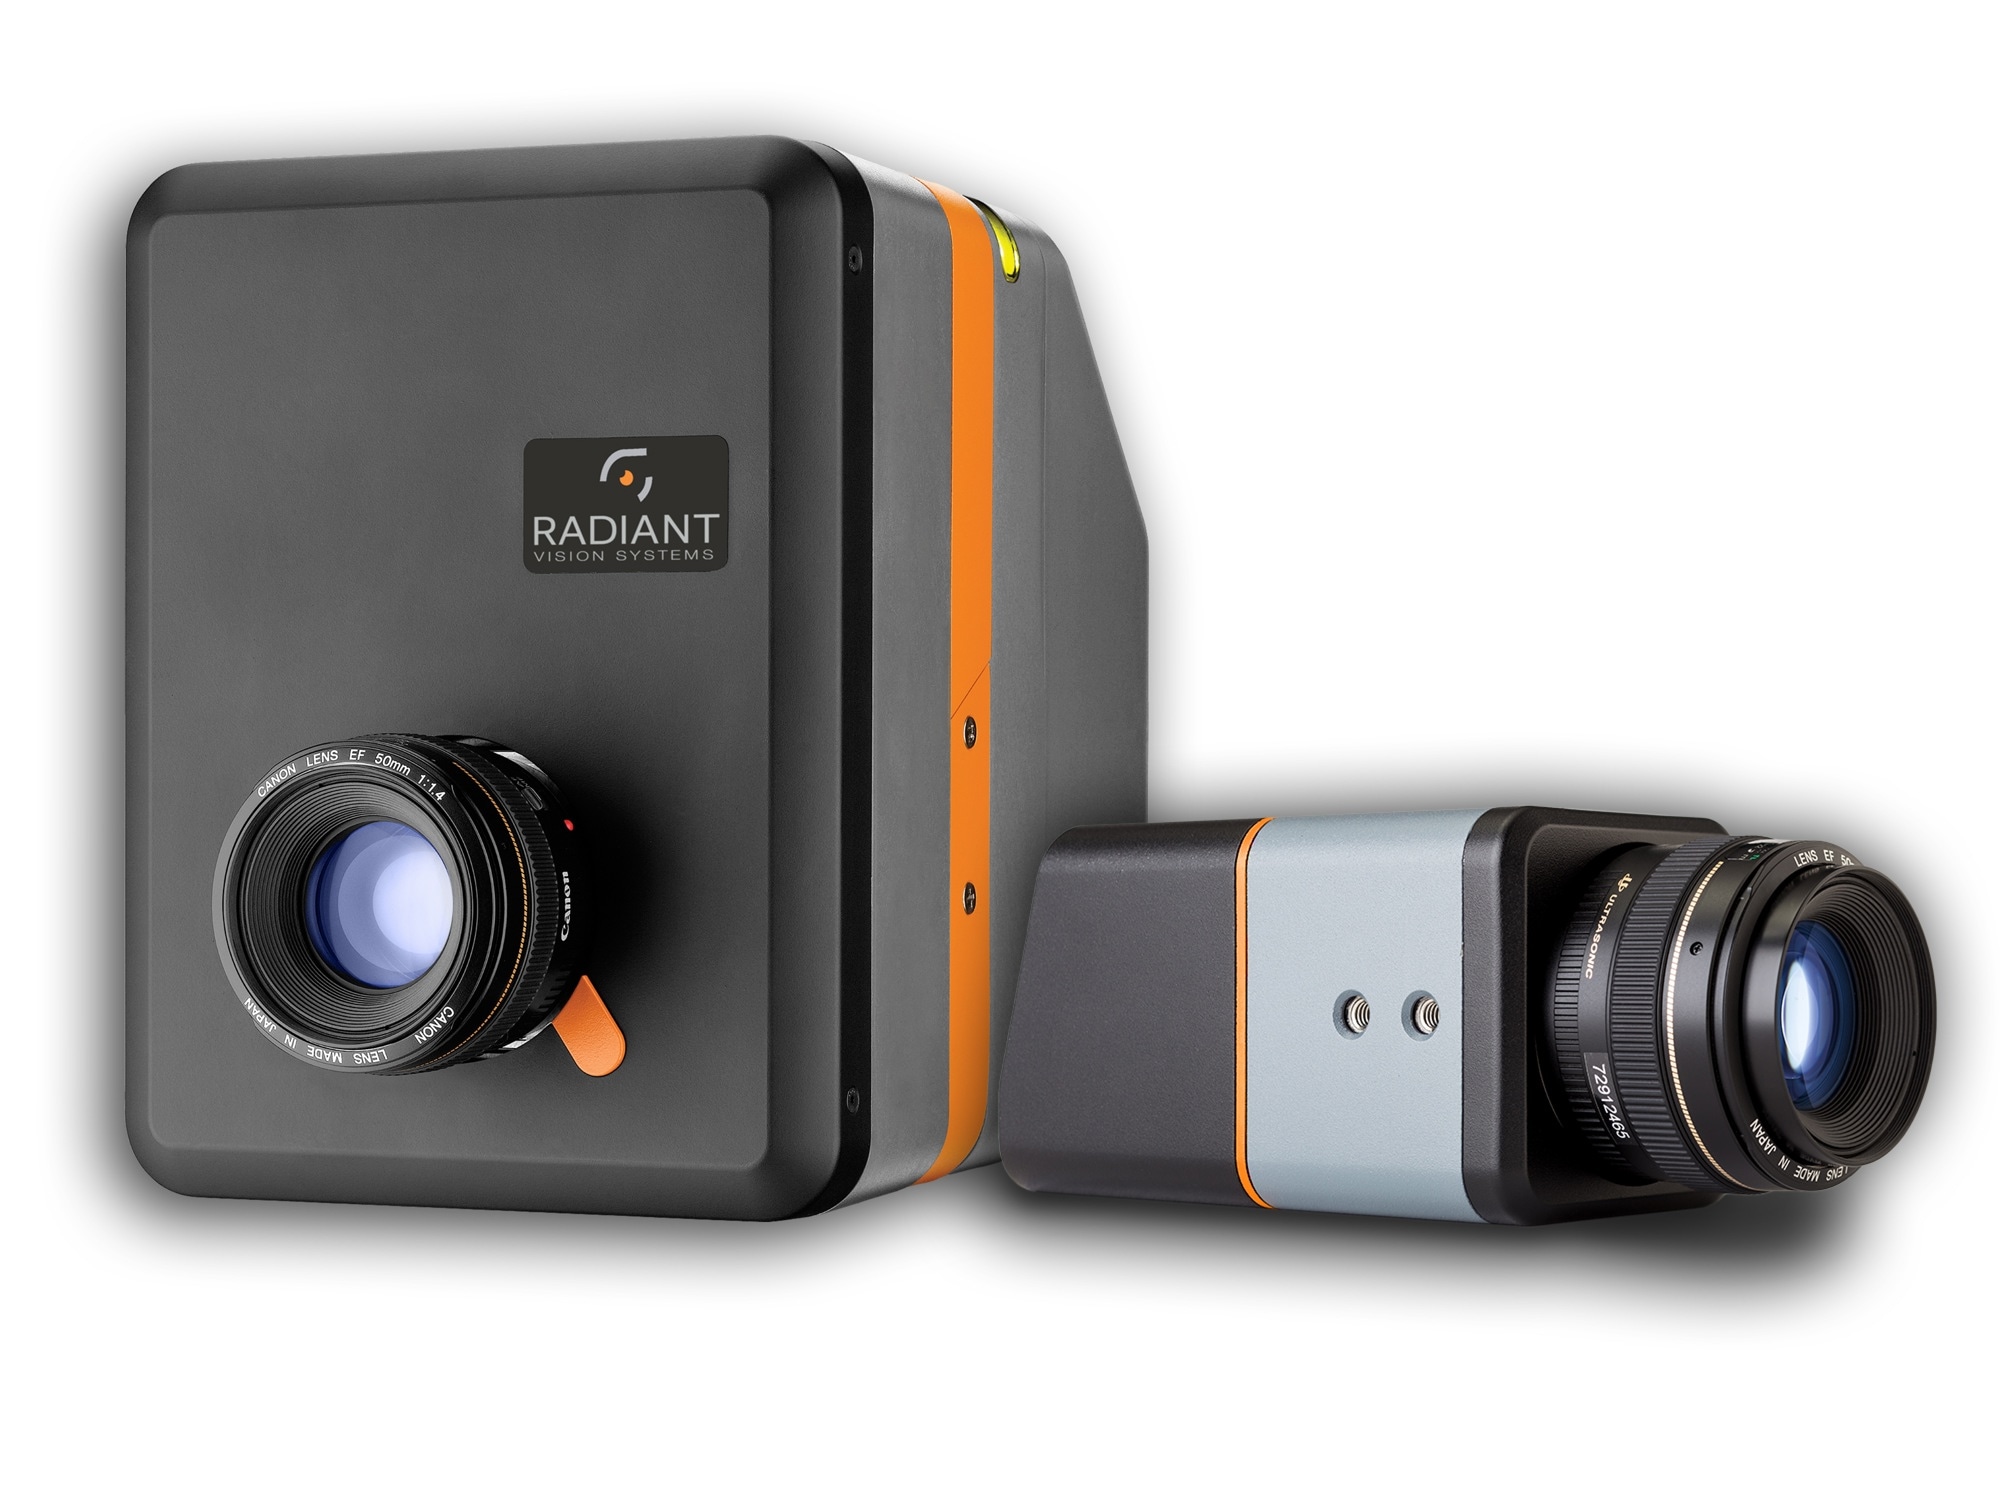
Imaging colorimeters and photometers are advanced imaging systems with optical components that simulate human visual perception of light and color. Many systems include beneficial features for automated HUD measurement such as electronic lenses, dynamic point-of-interest creation, and multi-step test sequencing software.
A camera is positioned in the eye box area relative to the position of a vehicle operator in both images. The camera is facing in the same direction as the HUD system, which is projecting digital images to the back surface (called a paravan) of a dark tunnel, utilized to occlude ambient light.
A connected computer system where software is running to control HUD system projections for testing, in addition to capturing, storing, and processing measurement data, is not pictured in both illustrations.
The manufacturer has used a machine vision system and a spot meter in the first image (Figure 3), to measure light and assess the physical characteristics of projected images.
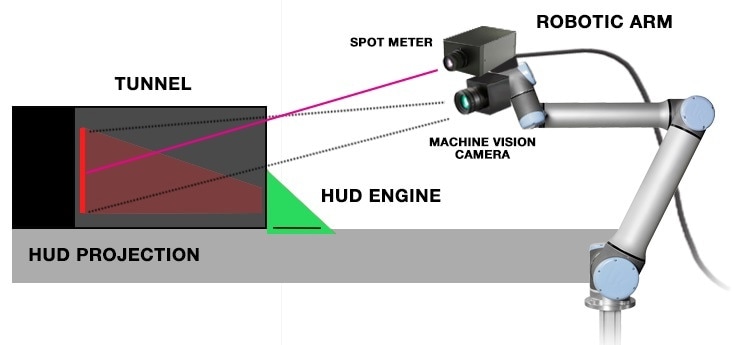
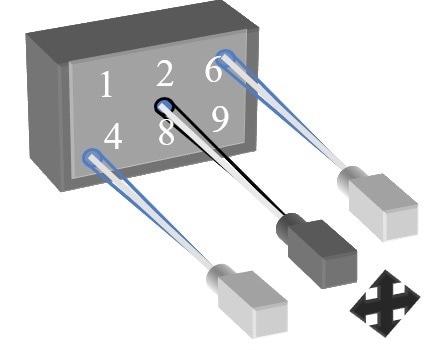
Figure 3. Example of HUD measurement equipment in a production application; a robotic arm integrated with a machine a spot meter for light measurement, and a machine vision camera for 2D image analysis.
As discussed, this type of solution requires a robotic arm or actuator to automate the process of gathering several measurement points with the spot meter. A spot meter and machine vision camera are integrated to the end of the robotic arm in this illustration.
This solution may be augmented further via human inspection to verify contrast evaluations and speed up the process of comparing the data gathered by the spot meter at multiple points. The manufacturer has used an imaging photometer for in-line HUD evaluation in the second illustration (Figure 4).
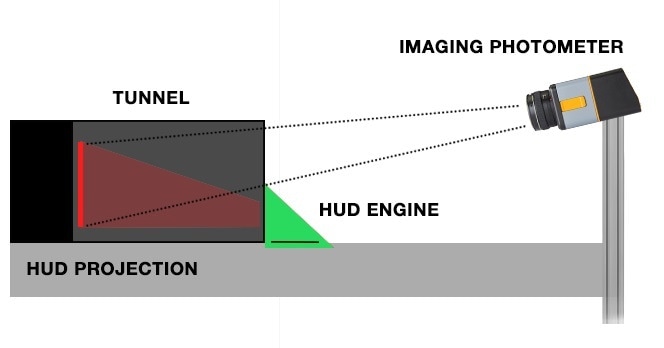
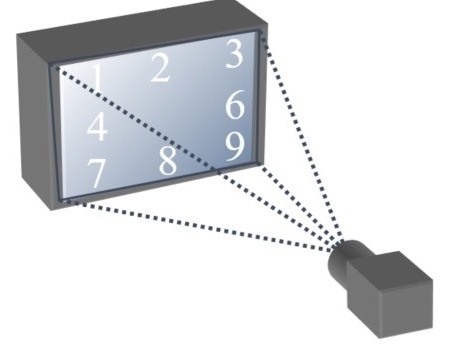
Figure 4. Example of HUD measurement equipment in a production application; a stationary imaging photometer used for simultaneous light measurement and 2D image analysis.
As the imaging photometer supplies both light measurement and visual inspection tools and can also capture two-dimensional images of the HUD projection, it can carry out all the measurements needed for SAE HUD evaluation in a single image.
The imaging photometer’s electronic lens (reviewed later in this paper) can account for differences in optical focus and image distance if repositioning of the measurement system is needed.
When comparing these two illustrations, an argument can easily be made against the spot meter/machine vision integration based on the amount of equipment needed, the cost of the solution, and integration complexity, in addition to the number of variables that must be maintained for system stability.
The time it takes to undertake a full evaluation of each HUD system should also be considered. While the spot meter/machine vision solution must capture measurement data at several points, the imaging photometer solution is able to evaluate a complete HUD system in a fraction of the time, making the system more suitable for production scale inspection.
SAE Measurement Criteria Simplified by Automation
Calculating Object Distance and Location
SAE J1757-2 specifies that an optical measurement system for HUD evaluation must measure the “real distance” between an opaque monocolor paravan (surface) positioned at the perceived distance of the projected virtual image to the nominal eye center (from the operator’s nearest visual focal point).
When using standard measurement systems, distance measurements from near to far are determined via the camera’s focal distance to assess the points along the horizontal plane where the camera can image objects in focus.
To understand the physical distance between the two points these measurements must be calculated as real distance units. The calculations necessary to convert focal distance to real distance units can be manually performed, but there are also measurement systems which can automatically perform this conversion.
These systems supply focal-to-real distance conversion via built-in software algorithms, allowing operators to display measurement data in real distance units in the system’s software results. Time savings are the obvious advantage in the application of such systems.
Data in the unit of measurement required is instantly available, decreasing the time and margin for error which is otherwise inherent in calculating and converting separate sets of data points.
Undertaking Multiple Measurements
To average out the margin of error, and account for multiple potential viewing angles from the vehicle operator to the HUD projection, SAE J1757-2 requires at least three measurements at different locations on the paravan in order to establish the relative virtual image distance.
The process of measuring multiple points is time-consuming and arduous when using standard fixed-lens measurement systems. At each position, manual adjustments must be made to the camera to ensure the images are in focus for equivalent measurement data over measurement points.
Alternatively, systems with electronically controlled lenses enhance the speed and accuracy of measurements at several positions, angles, and distances greatly. These lenses may be adjusted remotely to ensure proper aperture and focus settings for image location at the paravan, or on an infinite plane, as shown in the examples.
As the imager is repositioned to carry out a successive measurement, a few small modifications can be done in the system software to adapt the imager’s electronic lens quickly, in order to focus on objects at any location or distance.
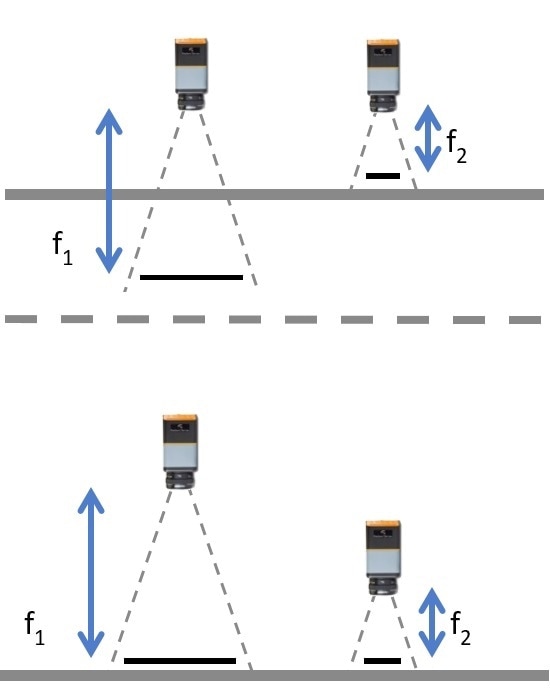
Figure 5. An imaging system with an electronically-controlled lens is able to remotely adjust aperture and focal settings for projected images, whether images appear at varying distances to the eye, or if the camera is positioned nearer to digital images within the HUD projection.
Measuring Luminance of Colored Objects
As stated in SAE J1757-2, minimum luminance thresholds must be attained to ensure visibility of the HUD’s virtual images superimposed upon the real-world environment in any ambient lighting condition (night or day).
Yet, measuring the luminance of every virtual image in a HUD projection means accounting for a large scope of object colors, sizes, shapes, and locations. When utilizing a measurement system that locates objects based on static points of interest (POI), multiple steps are necessary for this process.
A static POI system finds the target object within the inspection area by looking within a static POI window drawn in the software for each object that is projected into the HUD. The imaging system will utilize this POI to establish which set of pixels in the image to apply luminance measurements.
The result may be an inaccurate luminance measurement if the projected object falls outside of this POI. Furthermore, as new virtual images are introduced on the display or projections change, new POI must be drawn to encompass each new object before luminance measurements can be gathered.
Some advanced light measurement systems supply software capability which automates the process of POI-setting fully for several, and even unpredictable objects in a projection.
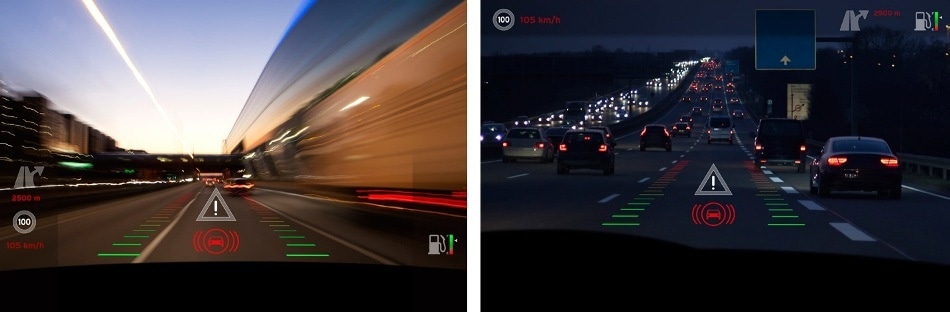
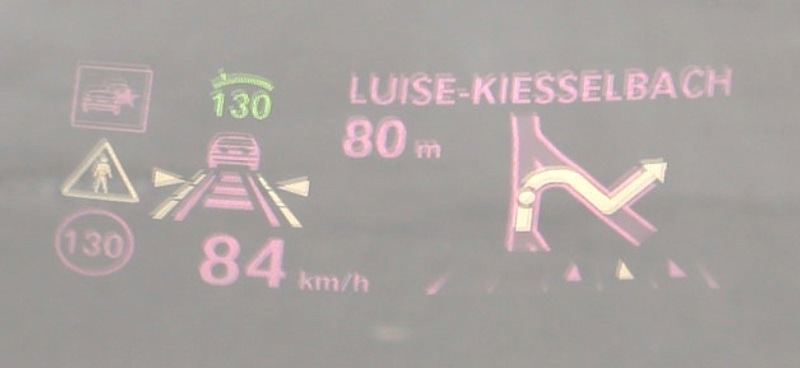
Figure 6. HUDs superimpose digital images on top of real-world environments, like AR. For this reason, a critical safety concern is visibility of projected images against all backgrounds. Images must be bright enough to remain discernible both day and night, and in all weather conditions.
For instance, a software feature called Auto-POI (Automatic Points of Interest), creates dynamic POI windows which adapt automatically to object pixels that fall within a defined color tolerance. A manufacturer may want to assess the luminance of all red objects in a projection at once.
The manufacturer would set minimum and maximum CIE color coordinates (Cx, Cy) in the software to encompass the range of red values represented in the target set of objects to perform this measurement.
Leveraging Auto-POI, the software would then “snap to” any set of continuous red pixels that match the defined criteria, generating accurate measurement regions regardless of object size, shape, or location.
Objects that match the defined color tolerances in Auto-POI would be captured even as new projections are introduced and measured for luminance values instantly and on demand. Auto-POI enables multiple color sets to be programmed instantly, allowing manufacturers to measure all objects in an image at the same time, regardless of color.
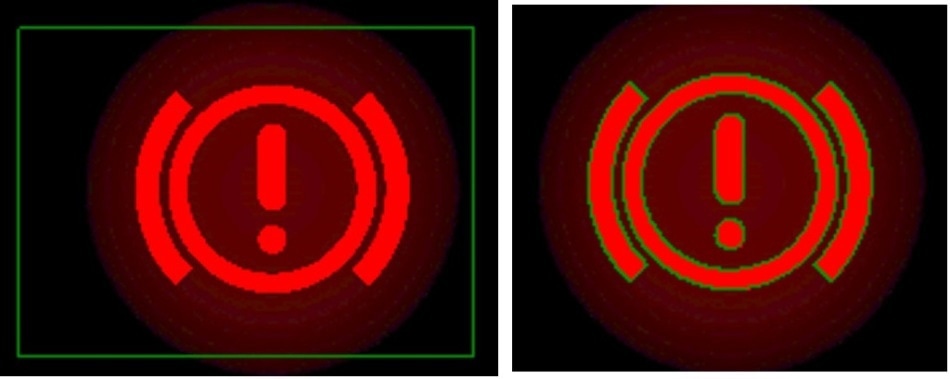
Figure 7. Comparison of static POI manually drawn in the software and Auto-POI (Automatic Points of Interest) adapted to an object based on color tolerances.
Additionally, the manufacturer has the choice to draw color regions on a CIE color chart (using the cursor to create an ellipse, rectangle, or polygon) or to enter CIE coordinates as data, or to specify POI tolerances when specifying color value tolerances.
Once all object colors have been defined, these features fully automate the measurement process, giving the manufacturer a “point-and-shoot” technique for luminance measurement.
Combining an electronically controlled lens with Auto-POI provides the ultimate flexibility in object location and evaluation for nearly instant data acquisition at each defined measurement point.
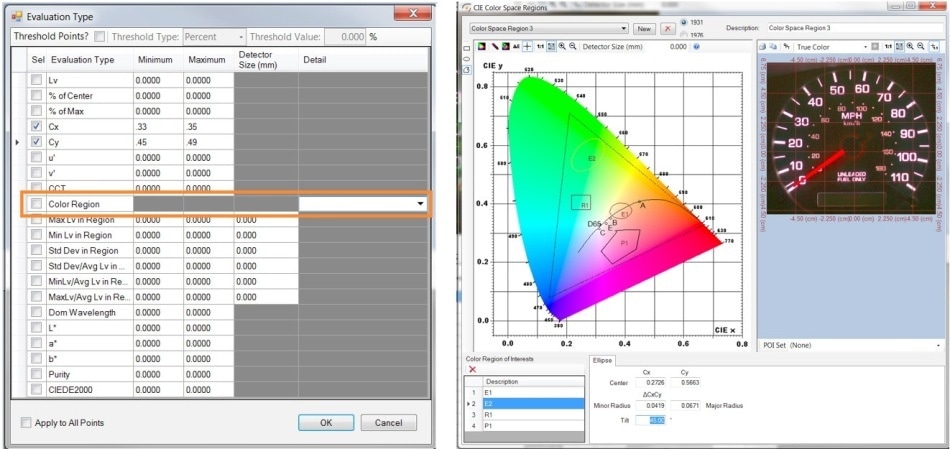
Figure 8. By selecting “Color Region” in the Auto-POI software tool, the user can draw shapes within the CIE color chart to define Cx, Cy tolerances for colored objects that should be included in the measurement POI set.
Measuring the Ghosting Effect
Objects in a HUD projection are visualized as a combination of reflections of light emitted by the HUD system. The windshield of a car, which is the primary display surface, is made up of an outer and an inner glass interface, they both receive HUD emissions and reflect them back to the driver’s eyes at a unique angle.
If the angular light emissions are not properly directed these reflections create the target virtual image of the HUD projection, plus a “ghost image”. When not aligned perfectly, this double image will lead to blurring that can impact the visualization of important HUD projections significantly.
The measurement system must be able to locate the position of correlating points from the ghost image to the target image in order to identify and evaluate the scope of ghosting in a HUD projection. These locations must then be compared to establish the extent of deviation and supply the information necessary to carry out corrections to the HUD.
Measurement systems which supply image processing like Register Active Display Area (RADA) in their software can automate the process of comparing the location of points on a distorted image with those of a target image in a single evaluation. Typically, RADA is utilized to process warped, skewed, or misaligned images and render them in the correct aspect ratio and shape.
An inspection system with RADA functionality is pre-equipped to capture and compare coordinates which show object location, as RADA must gather object positioning data about the ideal and actual virtual images to undertake this process, automating the detection and measurement process for image ghosting.
Ghosting of the image is caused by misalignment of HUD projections that are reflected back from the windshield.
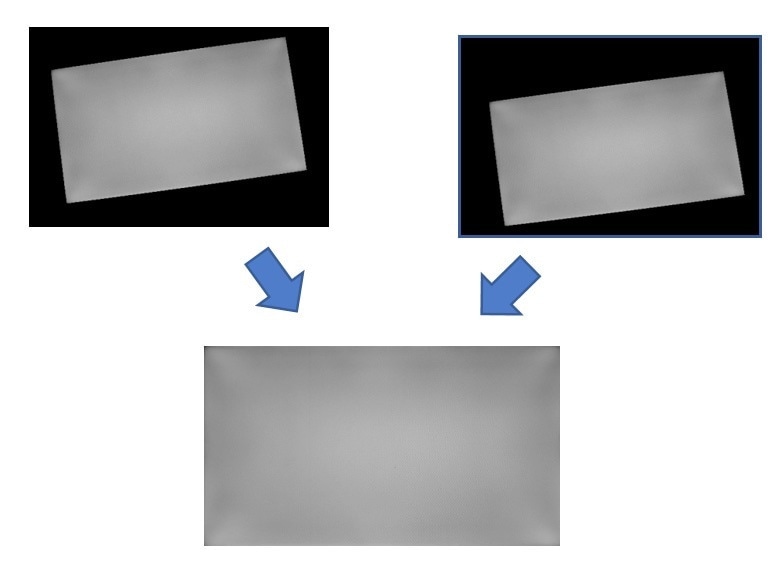
RADA automatically rotates and crops images to align images for measurement. RADA can be used to report corner pixel locations for both actual HUD projections and ghost images.
Measuring Image Distortion
SAE J1757-2 establishes distortion as the geometric deviation for each measured point in the virtual image as compared to target coordinates.3 Distortion may include image wrapping, aberration, or warping, all of which are established via the distance between edge pixels of a primary or measured virtual image and those of a secondary or target virtual image.
For HUDs, this defect may lead to improperly perceived depth of field or object focus, because of the non-uniformity or misalignment of projected images which must be reconciled as a single image by binocular human vision.
Where the HUD fails to augment data in the appropriate relative position to real-world objects, incorrect positioning of projected images may also happen. This may have safety implications, and distortion also plays one of the most crucial roles in the perceived quality of the display, and the vehicle manufacturer who integrates it.
Distortion of an HUD projection caused by misalignment of the optical path within the HUD engine.
For accurate, automated distortion detection, Modulation transfer function (MTF) is crucial. MTF is a quantification of the imaging performance of an optical system, specifically defining a camera’s ability to generate an image of an object that accurately reflects the same resolution and contrast (sharpness) of the object as viewed in the real world.
There are multiple reasons that cameras do not generate images which are indistinguishable from reality, beginning with the behavior of light waves that are received by the camera and augmented by the limitations in the camera’s lens, dynamic range, and sensor resolution.
These factors influence the image quality, which will establish measurement accuracy as software tests are performed against the image. The MTF of an optical system is the measurement of the system’s capability to compensate for its own technical limitations and process light as accurately as possible.
As accurate measurement requires an understanding of where distortion is originating, MTF plays a key part in measuring distortion. Just as aberration may be present in a projection because of anomalies in the HUD system, aberration can also be caused by the camera as it captures light from the HUD projections to produce a measurement image.
The measurement system may return a false negative if the camera does not supply high enough optical performance to generate a clear image, indicating HUD image distortion where there is none.
This can create problems in subsequent tests where digital objects cannot be measured for location, size, or even total luminance accurately because image edges and features are not defined clearly by the camera.
Advanced measurement systems which supply MTF testing in their software permit users to test the camera’s optical performance and ensure the correct evaluation of HUD image distortion.
Some systems use ISO 12233 techniques to measure MTF by utilizing a slant-edge pattern to establish the performance of the imaging system, which supplies a particularly discerning evaluation of the camera’s performance.
Using this technique, the object to be imaged is located at an angled orientation so that dark-to-white boundaries in the object do not match the perpendicular axes of the camera’s sensor pixels.
The camera must be able to determine sub-pixel differences in luminance to project the location of an edge between dark and light areas as it crosses the sensor pixels, because the luminance value received by each pixel is not uniform.
This technique highlights the effective resolution of the camera’s sensor and its capability to create accurate, sharp images by assessing the system’s response to an “edge.” This response is known as the “Edge Spread Function.”
Measurement systems possessing the ability to evaluate their cameras’ performance based on these techniques are the most reliable for establishing the cause of HUD image distortion, and greatly decrease the margin for error in image analysis.
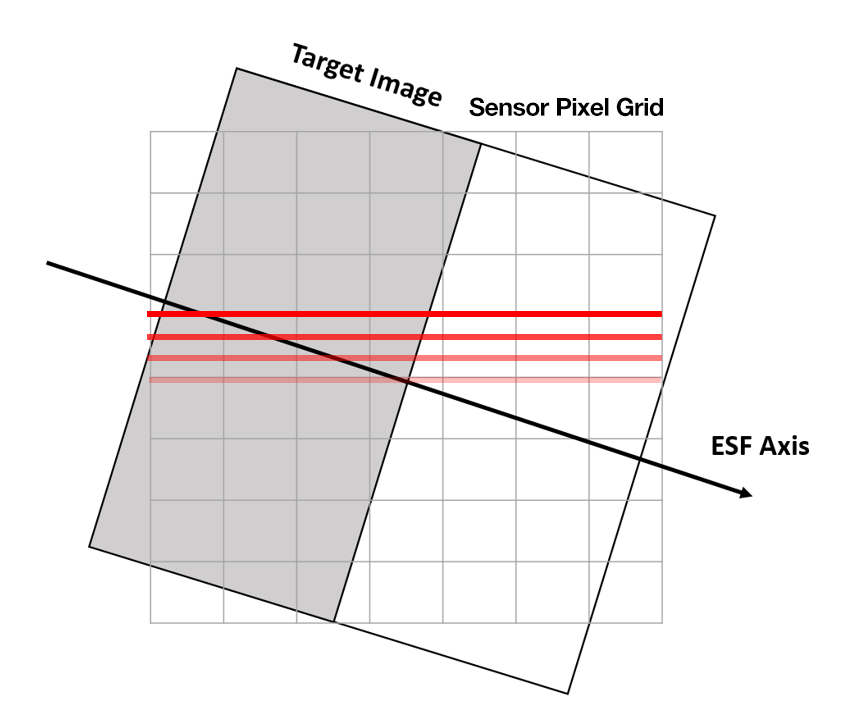
Figure 9. The target image is rotated 5 degrees off axis from the image sensor pixels in a slant-edge measurement used to calculate the camera’s ESF. The red lines indicate the luminance cross-sections of the region of interest for each pixel line.
Multi-Measurement Test Sequencing
The HUD test and measurement process invariably consists of multiple steps for complete quality evaluation, due to the unique nature of HUD projections and observer visibility requirements, including the object positioning and brightness criteria outlined above.
As stated in SAE J1757-2, the measurement system must carry out luminance measurements on checkerboard images with alternating patterns to establish virtual image contrast for black and white projections in ambient light.
The system must also establish luminance uniformity and non-uniformity of the virtual image, plus chromaticity, as compared to the target virtual image. Further measurements must be performed to establish image distortion and aberration, to ensure accurate image location and shape compared to the target virtual image.
The complexity of undertaking all the measurements needed for complete HUD evaluation is dependent not only on the limitations of the measurement software but also on the flexibility of the hardware.
If the selected system uses software developed to run a single measurement at a time, or, if the system uses multiple software packages engineered for unique measurement applications, the total measurement process can be extremely time-consuming.
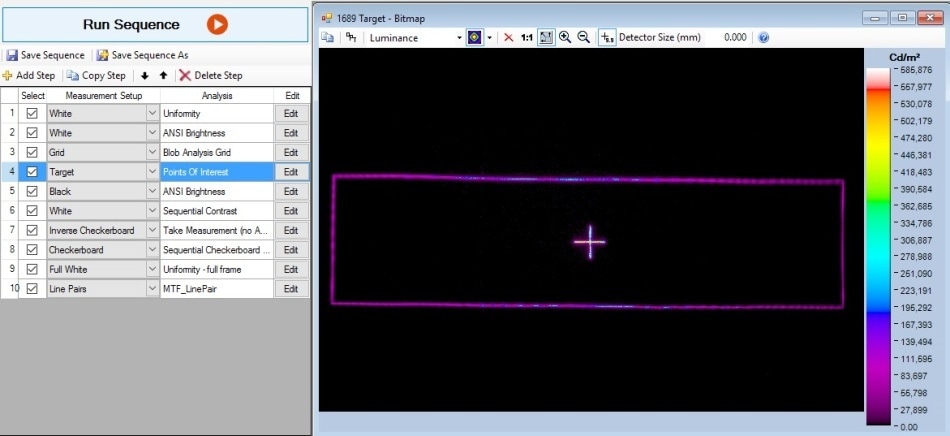
Figure 10. The test sequencing software above is programmed with ten steps, from uniformity to MTF line pair analysis, to perform multiple measurements of the HUD projection at once.
Applications utilizing a photometric system for light measurement for example, with an additional visual inspection system capable of object position measurement. Alternatively, automated test sequencing software can be applied to permit multiple measurements to be carried out in quick succession via a single system.
Test sequencing software programs permit distinct measurement criteria, POI, and inspection tolerances to be programmed into a series of separate steps within one software environment and then performed as a multi-part evaluation of the HUD.
This enables chromaticity, luminance, location, and distance measurements to be undertaken to measure several details of the HUD automatically without reprogramming the measurement software for entirely new criteria or system replacement.
Conclusion
With the finalization of the SAE J1757-2 standard paired with the quick growth of the HUD market, the call for efficient measurement systems is due to grow to ensure automotive suppliers and manufacturers achieve compliance and stay relevant and competitive in their industry.
As SAE standard compliance becomes the baseline qualification for HUD choice, the competitive benefit for manufacturers will be the efficiency and speed to create quality products that ensure optimal value of their technologies.
Automated HUD measurement systems which include imaging photometers or colorimeters with advanced test sequencing software decrease HUD evaluation time greatly, ensuring compliance, allowing production-level measurement, and limiting time to market and cost.
References and Further Reading
- MarketsandMarkets. (2016, April). Report Code AT 2973: “Automotive Head-up Display (HUD) Market by HUD Type (Windshield & Combiner), Application (Premium, Luxury & Mid Segment Cars), and by Geography (Asia-Oceania, Europe, North America & RoW) - Industry Trends and Forecast to 2021”.
- SAE International. (2015, May). Standard J1757/1_201505: “Standard Metrology for Vehicular Displays”.
- ISO. (2017, February). ISO 15008:2017: “Road vehicles – Ergonomic aspects of transport information and control systems – Specifications and test procedures for invehicle visual presentation”. https://www.iso.org/standard/62784.html
- SAE International. (2018, November). SAE J1757-2: “Optical System HUD for Automotive”.

This information has been sourced, reviewed and adapted from materials provided by Konica Minolta Sensing Americas.
For more information on this source, please visit Konica Minolta Sensing Americas.