In recent years, piezoelectric ultrasonic techniques have been increasingly used to analyze the fatigue behavior of high-performance metals, such as metal matrix composites (MMC) or titanium alloys in the very high cycle fatigue regime.
This innovative testing method demands appropriate tools for measurement and calibration, for example 3-D scanning vibrometry, which provides many benefits.
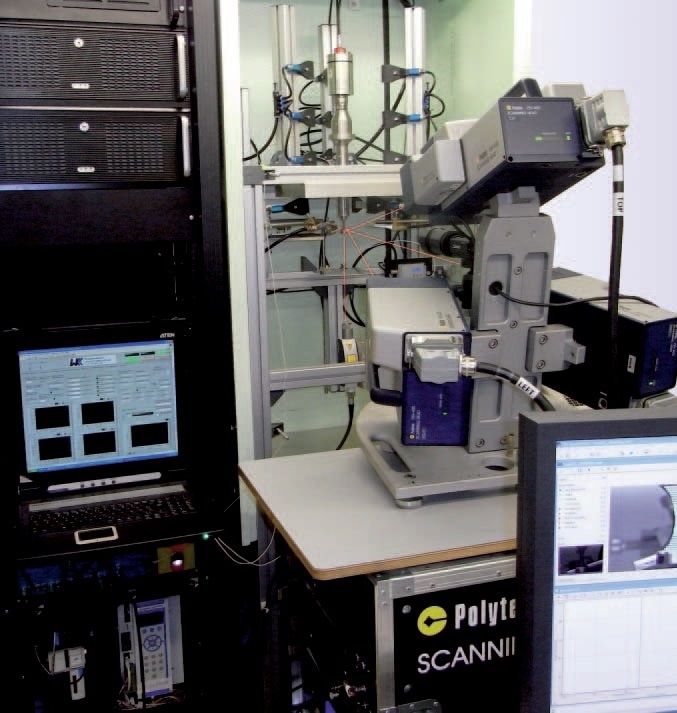
Figure 1. Experimental setup for ultrasonic fatigue testing.
Motivation
There are many highly engineered systems, ranging from for example heavily stressed motor parts to offshore structures, that must withstand up to over 10 million cycles either as a result of high frequency loading or a long, for example 30 year life expectancy.
This cycle range is referred to as the Very High Cycle Fatigue (VHCF) regime. Comprehensie knowledge of fatigue behavior of materials used in the VHCF regime is critical for dependable operation of these high-performance components.
Traditional long-duration testing can only be conducted at frequencies of up to 200 Hz.
The Ultrasonic Testing Facility
An unconventional ultrasonic testing facility for tension-compression experiments was created at the Institute of Materials Science and Engineering (WKK) at the University of Kaiserslautern in Germany to achieve, for example, 1010 cycles over short time periods.
The loading concept of the testing system is based on a piezoelectric transducer, which is engineered to resonate fatigue specimens at a frequency of 20 kHz with a standing longitudinal wave that generates fatigue in the material. Therefore, an eigenfrequency of 20 kHz is an important characteristic of the specimen.
Finite element analysis is utilized throughout the design process as a means to ensure an appropriate specimen design. The 3-D scanning laser vibrometer is used to accurately analyze eigenmodes and eigenfrequencies, and to verify the finite element model.
Strain and stress evaluation applying traditional methods, for example, strain gages, is quite difficult because of their tactile manner during high-frequency oscillation. Therefore the possibilities of using 3-D scanning laser vibrometry for high-resolution non-contact strain and stress measurement during ultrasonic fatigue were assessed.
Experimental Setup
A Polytec PSV-400-3D Scanning Vibrometer was employed for the experiments at the WKK. As shown in Figure 1, the three laser heads were positioned to make sure that the tapered region of the fatigue specimen was accessible.
Very low displacement amplitudes of 30 nm were chosen for determining eigenmodes and eigenfrequencies, to mitigate undesired fatigue damage of the material.
The 4 mm long gauge length in the center of the specimen, also the location of maximum strain, is where the strain measurements were focused. The specimen was excited at its eigenfrequencies with high displacement amplitudes of up to 42 μm.
Selected Results
Before fatigue, correlation with the FE model was carried out with specimens in their original state. Demonstrated in Figure 2a, the frequency response exhibits an eigenfrequency of 20.06 kHz and the eigenmode at this frequency (top of Figure 3) outlines the anticipated longitudinal oscillation.
Both results adhere closely to the FE results that were calculated. Moreover, intricate visualization of the high-frequency oscillation verifies that in this investigation, specimens are oscillating correctly.
Similar investigations were performed on a specimen loaded with a stress amplitude of only 50% of the yield strength. Despite this, fatigue failure happened after only 1.2 * 109 cycles as a result of interior fatigue damage.
Compared to the initial state, the eigenfrequencies decreased due to this subsurface fatigue damage. Shown in the lower half of Figure 3, the eigenmodes in the range of 20 kHz also exhibit obvious differences. An extensive inhomogeneity in the area of fatigue failure and an asymmetric velocity distribution across the specimen were both recorded.
Figure 4 illustrates the strain distribution while the high-frequency oscillation was performed, with a maximum in the center of the specimen.
The correlation between stress amplitude in the gauge length calculated with the 3-D scanning system and displacement amplitude at the free end analyzed by Polytec’s CLV-2534-2 single-spot vibrometer demonstrates an increasing displacement amplitude and an increase of stress amplitude.
A comparison with the correlation established on the FE model displays a high level of conformity (as shown in Figure 5).
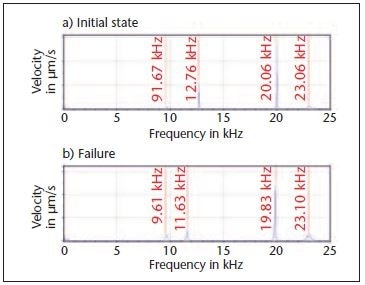
Figure 2. Frequency response. a) initial; b) after fatigue damage.
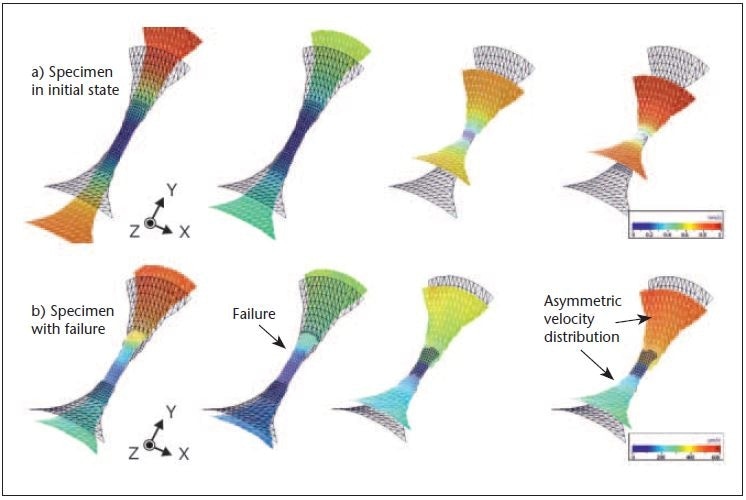
Figure 3. Deflection shape; above: initial; below: after fatigue damage.
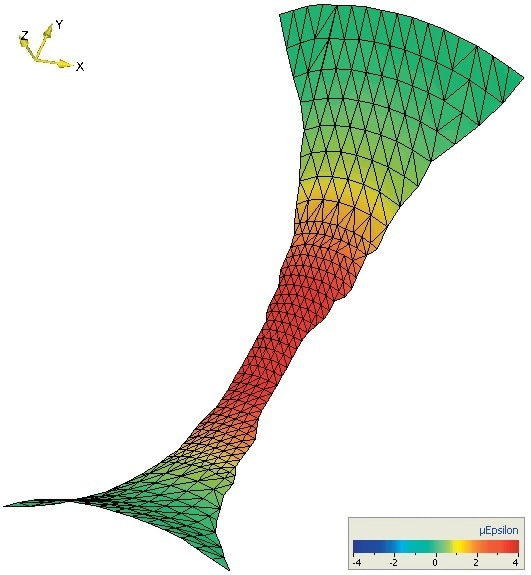
Figure 4. Strain distribution.
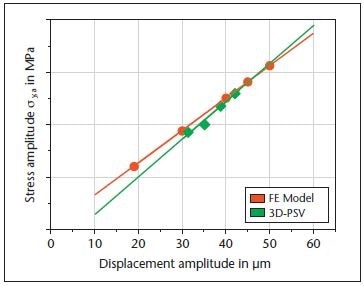
Figure 5. Comparison of FE model and measurement.
Conclusion
The investigations presented in this article show the potential applications of 3-D scanning vibrometry in the field of ultrasonic fatigue testing of metals. The outcomes of the investigations of the eigenmodes of specimens with various states of fatigue demonstrate the possibility to locate fatigue failure and to characterize the current fatigue status.
3-D scanning vibrometry can measure local strain in a non-intrusive manner with a high spatial resolution and provides a different approach to conventional methods such as strain gages for the assessment of high mechanical stresses across the gauge length under ultrasonic fatigue testing.

This information has been sourced, reviewed and adapted from materials provided by Polytec.
For more information on this source, please visit Polytec.