The instrument transfer function (ITF) is one of the approaches used for characterizing a system. The ITF defines system response based on the frequency content of an input signal. Reliable detection of polishing errors over a particular frequency range is an essential task to be performed by metrology tools.
Hence, it is necessary to understand the response of such tools as a function of lateral feature size. This article reviews the meaning, applicability, and measurement of the ITF for surface profiling interferometers.
Linear Systems
ITF is typically applied to linear systems, which share some fundamental properties for frequency analysis. Principally, a linear system’s response is the sum of the responses individually produced by each of the component signals. It is possible to propagate two frequency components present in an input signal separately and sum up the outcomes.
Another characteristic of linear systems is that the response for specific spatial frequency f along a coordinate x is provided by a corresponding ITF value characteristic of the system, independent of signal magnitude and phase. The formula for determining the output g'for an input g is
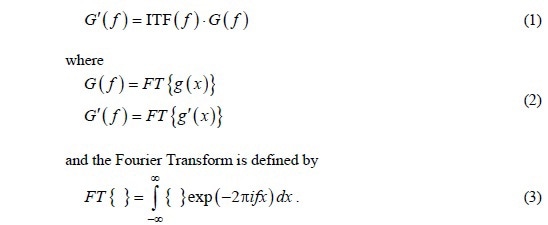
This is an efficient approach to estimate system response to different stimuli.
Optical Transfer Function
The optical transfer function (OTF) is a familiar ITF that demonstrates how an optical instrument reproduces images at different spatial frequencies. The modulation transfer function (MTF) is the modulus of the OTF.
Considering a limiting aperture’s effect in an unaberrated imaging system’s pupil plane is one approach to the OTF. A perfectly flat object is illuminated by a plane wavefront produced by a point source, as illustrated in Figure 1. It may be possible to dissect the object reflectivity profile with respect to sinusoidal amplitude gratings over a suite of spatial frequencies.
Allowing DC offset for each constituent grating produces, for each grating, three diffraction orders, -1, 0, 1. The grating frequency is proportional to the isolation of the ±1 orders in the pupil plane.
According to the Abbé principle, the system can resolve the corresponding frequency when all of the diffracted beams are captured by the pupil aperture. If the optical system is assumed perfect and conforms the sine condition, the principle rays, as shown in Figure 1, indicate that the amplitude reflectivity frequency content is reliably reduced by the optical system up to a limiting frequency NA/lambda;. Hence, the coherent imaging MTF is a simple rectangle, as depicted in Figure 1.
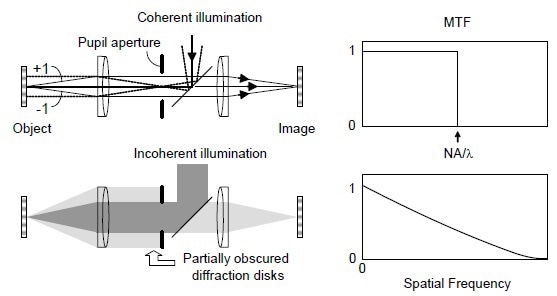
Figure 1. Illustration of incoherent and coherent light imaging systems (left) and the corresponding MTF curves (right).
The logic is very much the same for an extended, incoherent source, as shown in Figure 1, but there is a vast difference in the results. The different source points in the pupil result in overlapping, thus adding together mutually-incoherent images as intensities.
The obscurations of the ±1 diffraction orders differ when traversing through the pupil. The estimation alleviates to the autocorrelation of the pupil plane light distribution, which for a uniformly-filled disk is

The spatial frequency curve, shown in Figure 1, depicts the gradual declination from zero out to double the coherent frequency limit.
ITF for Optical Profilers
The ITF holds potential to be used it even for explicitly nonlinear systems. With appropriate cautions, these systems can satisfactorily be approximated as linear over some limited range, as in the case of optical profilers.
It is possible to estimate and convert the imaged phase profile back to height utilizing any of the available interferometric techniques. Although, each grating produces diffracted beams, Figure 2 illustrates that for phase gratings, the light extends into higher angles than mere the -1, 0, 1 orders existing with amplitude gratings. Depending on the depth of the grating, more number of powerful higher diffraction orders is generated.
The coupling of spatial frequencies causes harmonics and beat signals in the imaged wavefront, disagreeing the simple formula of Equation 1. Now, the system response is inseparable from the characteristic of the object itself. Interferometers are nonlinear devices like all optical tools that encode height data as wavefront phase.
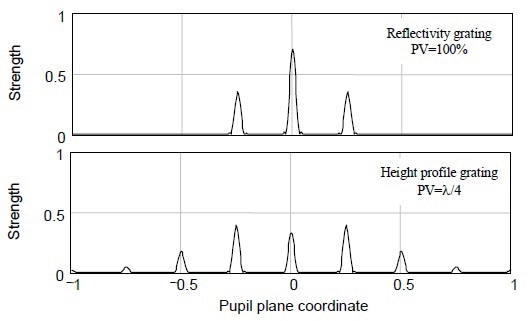
Figure 2. Comparison of the diffracted beams from amplitude (upper) and phase (lower) gratings illustrates the complex diffraction behavior of height objects, leading to nonlinear response when profiling surface heights.
The solution to this problem is to limit to small surface heights, wherein small means << λ/4. The response of the optical system to these small surface heights is much in the same way when it images pure intensity objects.
This suggests the possibility of approximation of the ITF by the OTF. This concept can be demonstrated by a simple example. An interferometer is arranged in such a way that the reference phase is balanced at a point at which the intensity I is more sensitive to alterations in surface height h. Then, the resulting formula is

where I0 is the DC offset I' is the amplitude of the intensity signal and K = 2π/λ. Inversion of Equation 5 is the approximation,

Equation 6 shows a linear relationship between intensity and height. The coherent interferometer ITF is the same as the coherent imaging OTF for small surface heights.
Measuring Interferometer ITF
One of the most convenient ways to measure OTF is imaging a sharp reflectivity step created, for instance, by depositing a thin chrome layer (<< λ/4) over one-half of a flat glass plate. The OTF is directly provided by the ratio of the frequency components.
ZYGO's Verifire™ HD Interferometer & Nomad™ Optical Profiler Demos at Photonics West 2016
In Figure 3, the ITF for one of white light interferometers shows the close matching between the resulting experimental ITF magnitude and the calculation based on the incoherent imaging MTF derived from Equation 4. The camera often limits the resolution of low-magnification systems.
The ITF of laser Fizeau interferometer that is configured for coherent imaging is shown in Figure 4. It is assumed that the coherent optical ITF is equal to one for the theory curve over the complete spatial frequency range, while the ITF is modulated by the finite pixel size by a sinc function.
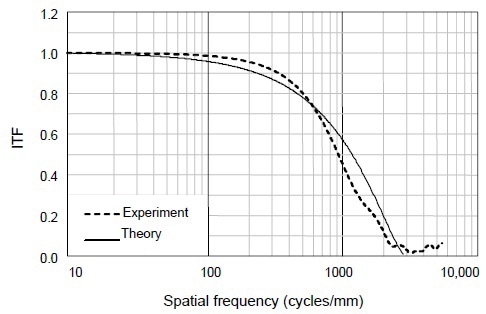
Figure 4. The predicted and experimental ITF curves for this 100-mm aperture coherent laser Fizeau interferometer are dominated by the lateral resolution of the 640X480 camera. Here the data stop at Nyquist because the sampling is too sparse above this frequency.
In Figure 5, a range of microscope objectives covered in incoherent imaging that includes the camera effects is shown.
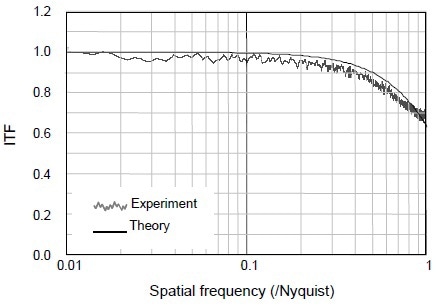
Figure 5. Theoretical ITF curves for 2.5X, 5X, 20X and 100X microscope objectives illustrate the spatial frequency overlap achieved in typical microscopes setups, and the influence of the camera at low magnification.
Conclusion
This article highlights the precariousness of utilizing a linear ITF for what is basically a nonlinear process of encoding height into the phase of a complex wave amplitude. A more accurate model involves an explicit estimation of this amplitude, followed by the propagation of the wavefront through the system in order to identify the role of the instrument. However, a kind of quasi-linear ITF is useful to thumbnail the limitations and capabilities of interferometers with respect to lateral feature size, and to assess the effects of diffraction, defocus, coherence and aberrations.
Surface deviations must be small for a meaningful application of a linear ITF. This enables estimation of the expected characteristic for coherent illumination, as in laser Fizeau systems, and incoherent illumination, which is the standard for interference microscopes. The profiling behavior closely follows that of imaging in this limit of small departures. Hence, with appropriate cautions, it is possible predict performance utilizing the imaging OTF as a guide to the expected ITF.

This information has been sourced, reviewed and adapted from materials provided by Zygo Corporation.
For more information on this source, please visit Zygo Corporation.