The adaptive optics (AO) method is employed to enhance image quality when an optical system suffers from phase aberrations. Imperfections and misalignments of the illumination or detection optics can cause aberrations in optical microscopy. Inhomogeneities in the sample’s refractive index, on the other hand, might cause aberrations and decrease the contrast of the produced image.
Image Credit: pashabo/Shutterstock.com
This article looks at Furieri, T. et al.'s research paper which analyzes a method to achieve anisoplanatic aberrations in a small optical module that can identify and correct aberrations. The detection is based on a technique known as spinning-pupil aberration measurement (SPAM), which recreates the wavefront phase in various parts of the field of focus.
Image sharpening and pupil segmentation have been developed to compensate for optical aberrations in microscopy image data. For AO microscopy, wavefront sensorless control has become the standard. Image sharpening utilizes a merit function that shows the maximum when aberrations are reduced. Pupil segmentation takes a different approach: the pupil is segmented, and the phase of every segment is controlled using a liquid crystal panel.
Adaptive optics requires a complete redesign of some microscopes, adding complexity and limiting its usage in commercial systems. Using two deformable mirrors, Laslandes and Popovic use multi-conjugate adaptive optics. Anisoplanatic correction with liquid crystals, for example, appears to be a promising alternative.
This research analyzes a method to achieve anisoplanatic aberrations in a small optical module that can identify and correct aberrations. The detection is based on a technique known as spinning-pupil aberration measurement (SPAM), which recreates the wavefront phase in various parts of the field of focus.
Results
The approach includes placing a device near a widefield microscope pupil that can detect and correct aberrations. However, this method is tested in a widefield fluorescence microscope as shown in Figure 1.
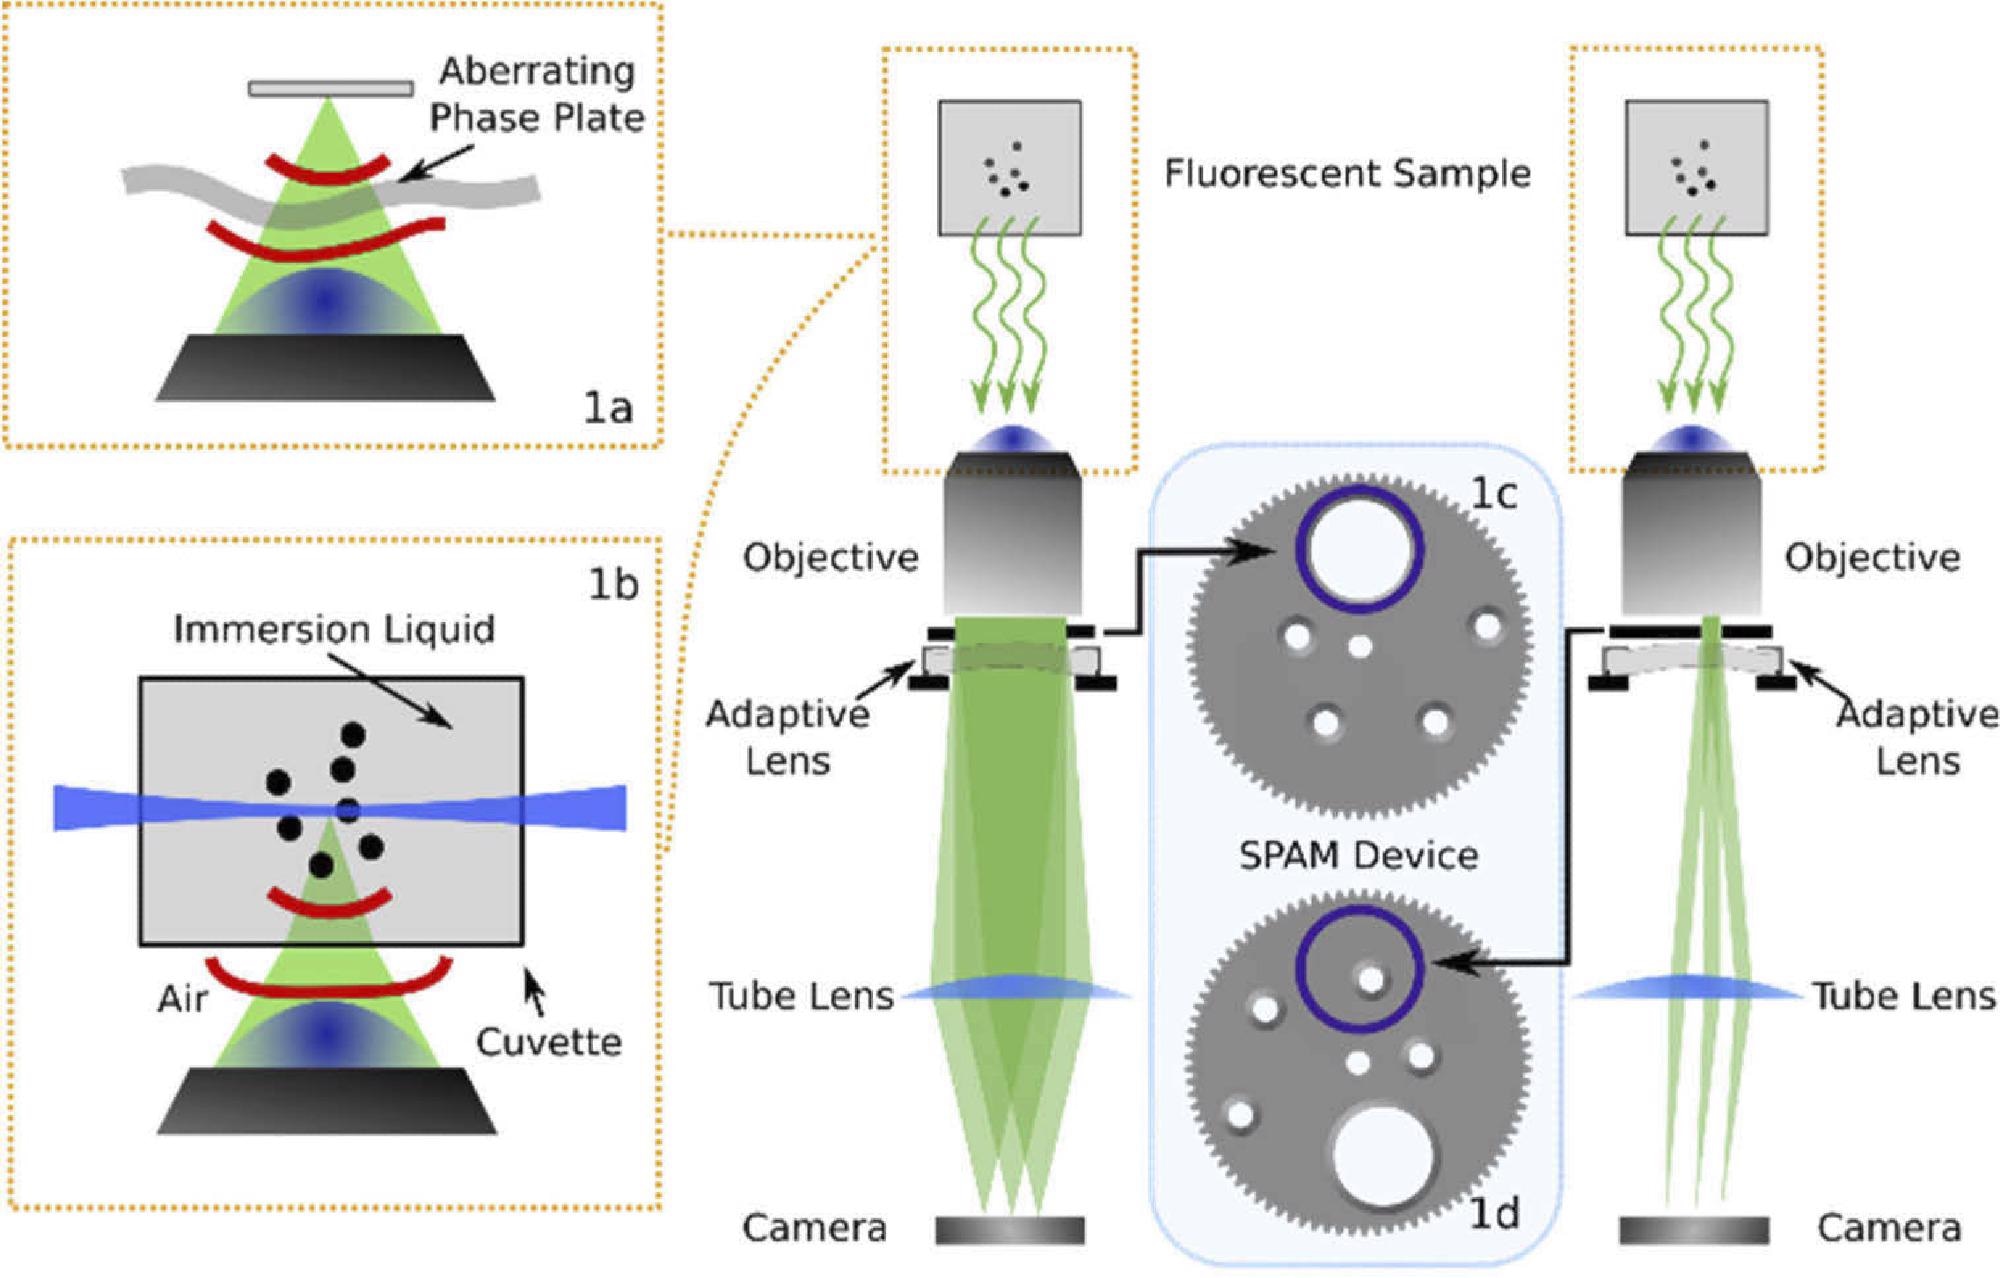
Figure 1. Optical layout of the imaging system used in this experiment including the SPAM module in combination with an adaptive lens. The diagram shows the SPAM module in the full pupil position (c) and in the sub-pupil position (d). The microscope has been used in widefield (a) and light sheet microscopy (b) configurations, as illustrated in the insets. Image Credit: Furieri, et al., 2022
The lens begins in a flat position in the first experiment. In 9 × 9 points, the researchers measured the wavefront, which was aberrated by the phase plate as shown in Figure 2.
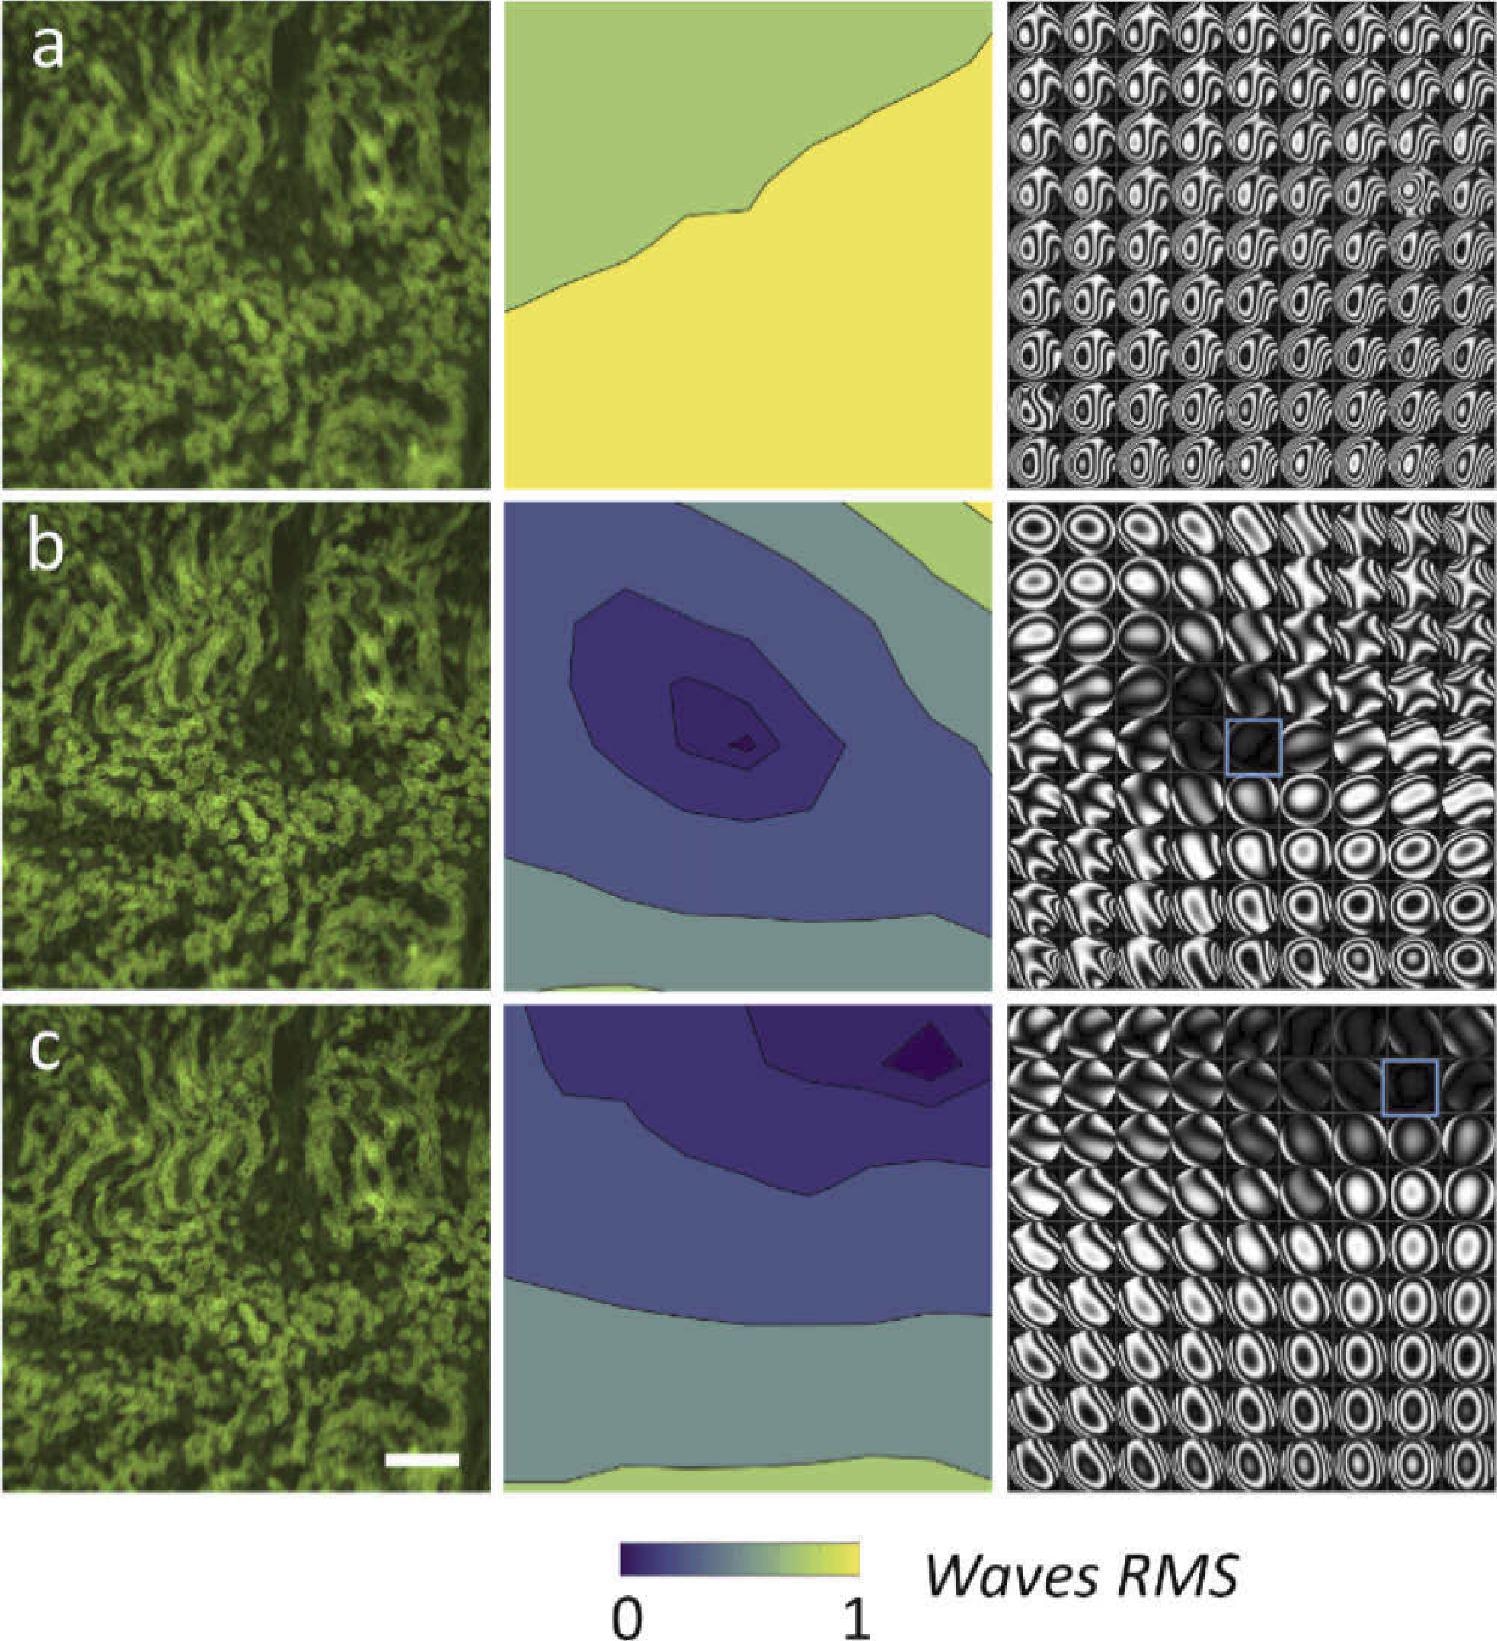
Figure 2. Comparison between the uncorrected and the AL corrected image, with correction in different region. Each raw shows an image of the sample, the RMS error (wavelength = 530 nm), and the wavefront phase aberrations represented as interferograms in a 9 × 9 grid. (a) Aberrated image without AL. (b) Corrected with AL in the central field. (c) Corrected with AL in the right-top corner. The correction region is indicated by the blue square. Scale bar is 200 µm. Image Credit: Furieri, et al., 2022
In the second place, the wavefront was adjusted in a single place, the image’s center. In both instances, the findings show that the adaptive lenses can almost entirely correct the aberration over the correction region as illustrated in Table 1.
Table 1. Comparison of the correction parameter for the widefield fluorescence microscope. The table reports the area (%) of the image below the Marechal criterion, the residual wavefront error for different corrected image segment (center and top-right, highlighted in blue in Figure 2), and the average wavefront error on the whole image. Source: Furieri, et al., 2022
| |
Below λ/14 (%) |
Segment RMS error (λ) |
Mean image RMS error (λ) |
| uncorrected |
0 |
|
0.78 |
| center |
3.7 |
0.04 |
0.33 |
| top-right |
8.6 |
0.03 |
0.30 |
The interfaces between the air, the glass, and the water contained in the cuvette caused a major spherical aberration in the system. The coma component of the aberration was greater for off-axis fields. The list of the wavefront measurements is shown in Table 2.
Table 2. Wavefront data relative to the fluorescent nano-beads acquisition. Source: Furieri, et al., 2022
| |
No AL FWHM (µm) |
AL Corrected FWHM (µm) |
No RMS AL (waves) error |
AL Corrected RMS error (waves) |
| Theoretical |
1.13 |
|
|
|
| Center |
1.79 |
1.35 |
0.54  |
0.01  |
| Bottom left corner |
2.30 |
1.57 |
0.69  |
0.23  |
The blood vessels in this sample have a lot of autofluorescence. The enlarged features of two sample sections corresponding to the brain Optic Tectum (center) and the Diencephalon (right) are shown in the figure panels (bottom-left) as depicted in Figure 3.
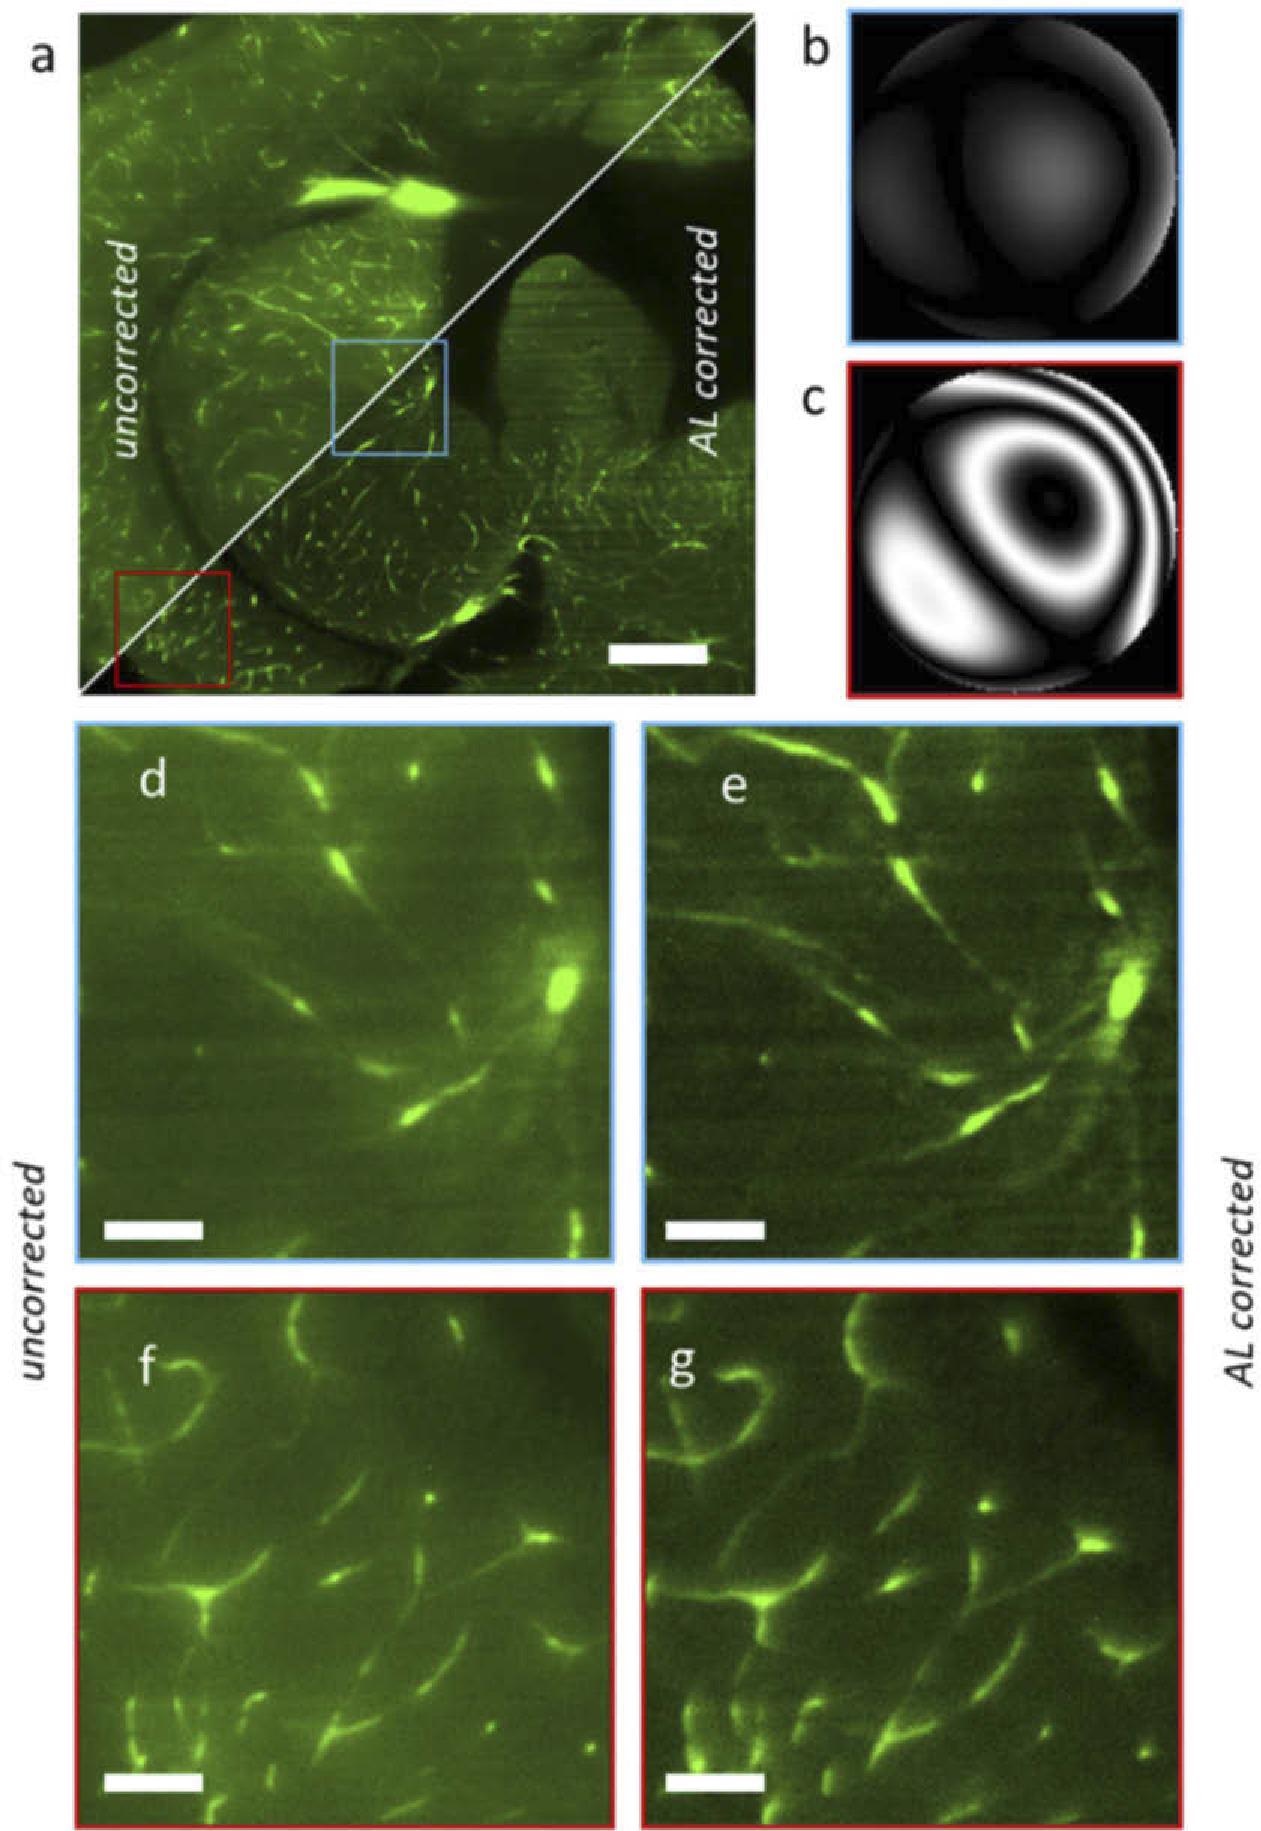
Figure 3. Light sheet microscopy acquisition of a chemically cleared adult zebrafish brain section, without and with AL correction. (a) Full image uncorrected (top-left triangle) vs corrected with the adaptive lens (bottom-right). (b) Wavefront aberration in the central region (blue in panel a). (c) Wavefront aberration at the left-bottom concern (red). (d-g) Magnified regions uncorrected (d, f) and corrected with the adaptive lens (e, g). Scalebar is 200 µm in a and 40 µm in b. Image Credit: Furieri, et al., 2022
The wavefront measurements reveal that the aberration is almost thoroughly corrected in the center field (0.05 waves RMS), although there is residual coma in the corners (0.27 waves RMS) as shown in Table 3.
Table 3. Wavefront error data relative the zebrafish brain sample (Figure 3), corrected in the central region. Source: Furieri, et al., 2022
| Region |
RMS (waves) |
| center |
0.05 |
| bottom left |
0.27 |
| mean in the full image |
0.22 |
Figure 4 depicts the phases in various places (5 × 5 regions are given), as well as the observed RMS wavefront error.
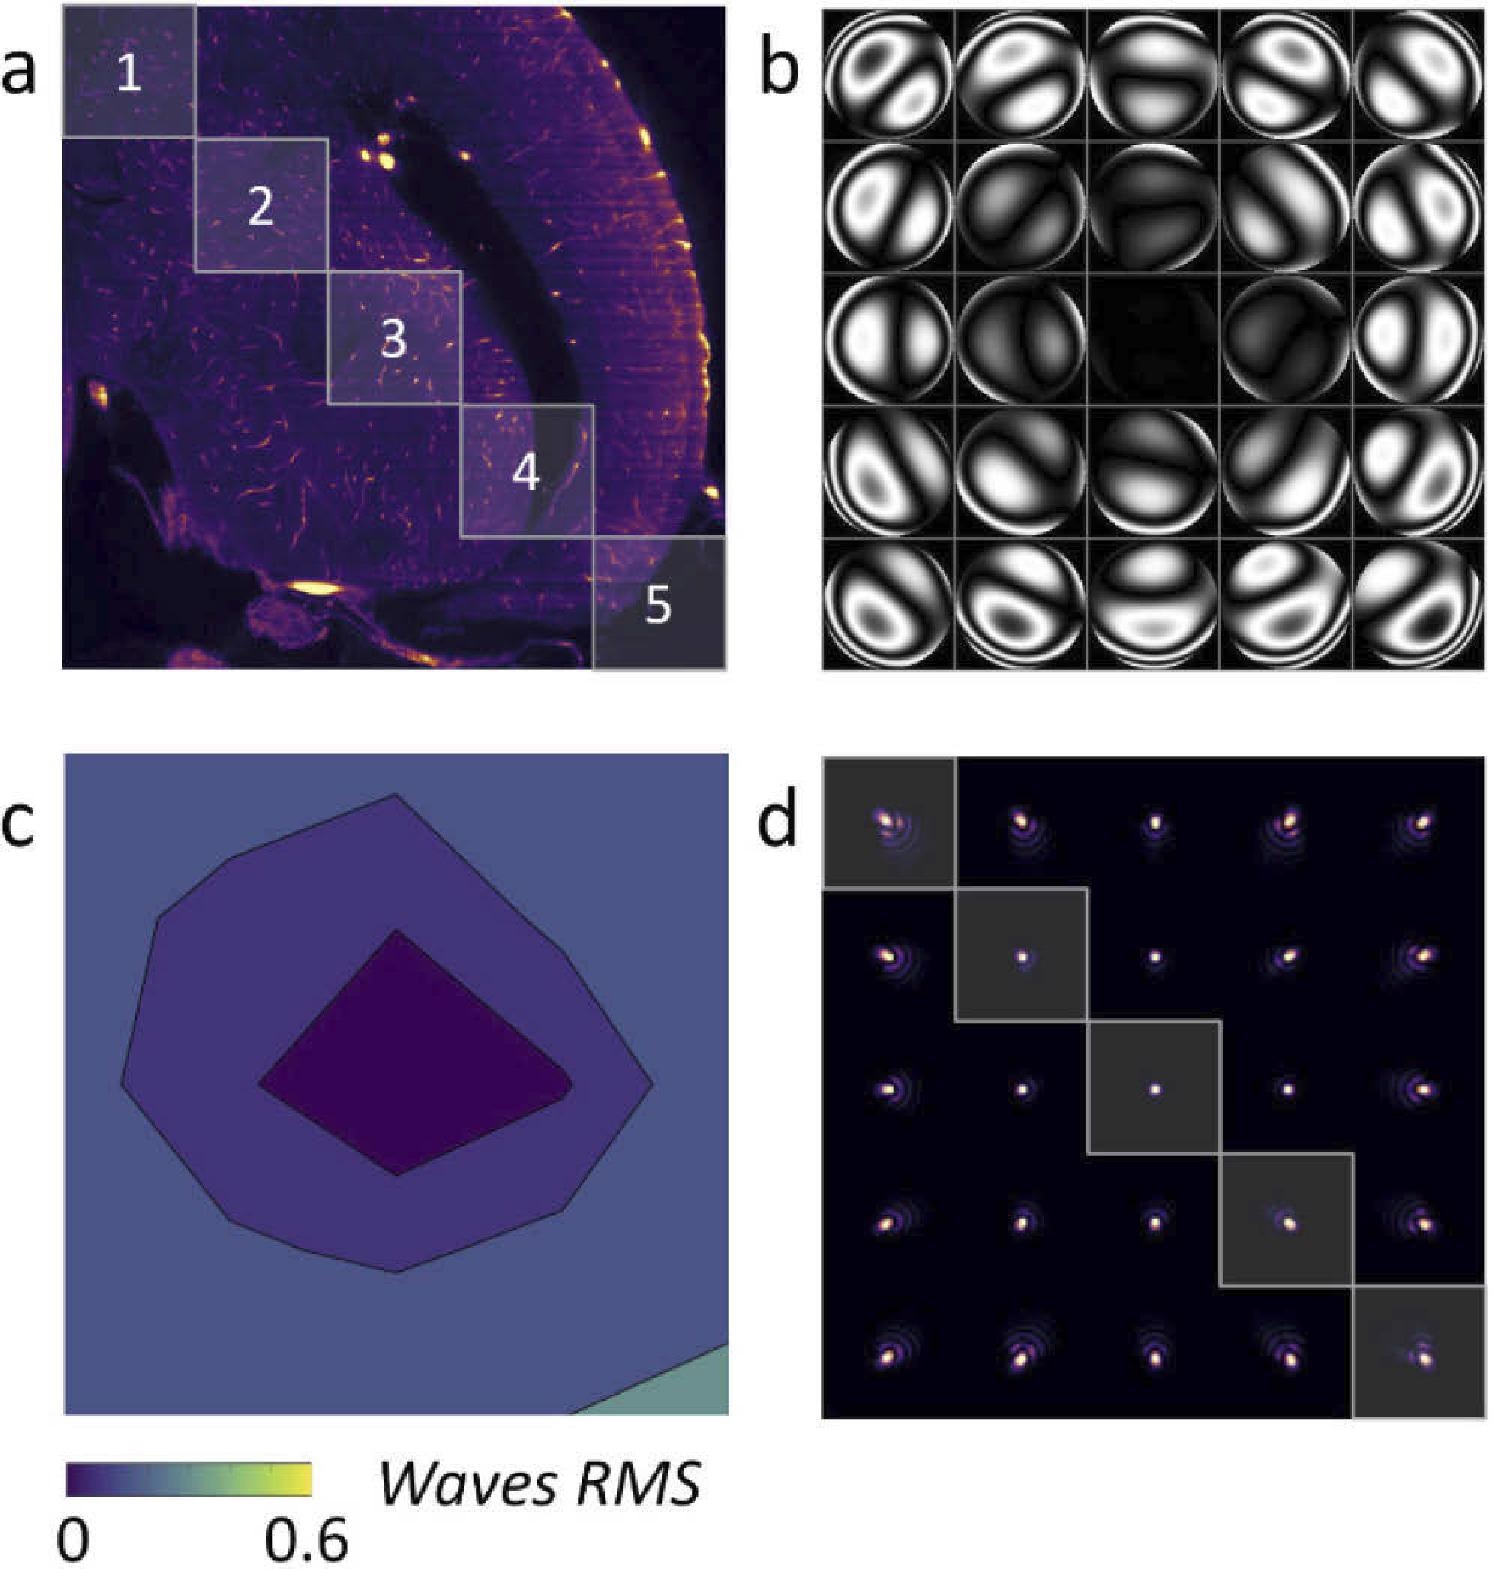
Figure 4. (a) LSFM acquisition of a zebrafish brain with AL correction in the image center. (b) Wavefront measured in 5 × 5 subregions of the image. (c) RMS wavefront error (d) PSF generated for each subregion. Image Credit: Furieri, et al., 2022
The deconvolution method successfully reconstructs the picture with better resolution and contrast over the whole field of view (see Figure 5), permitting the detection of single micro-vessels.
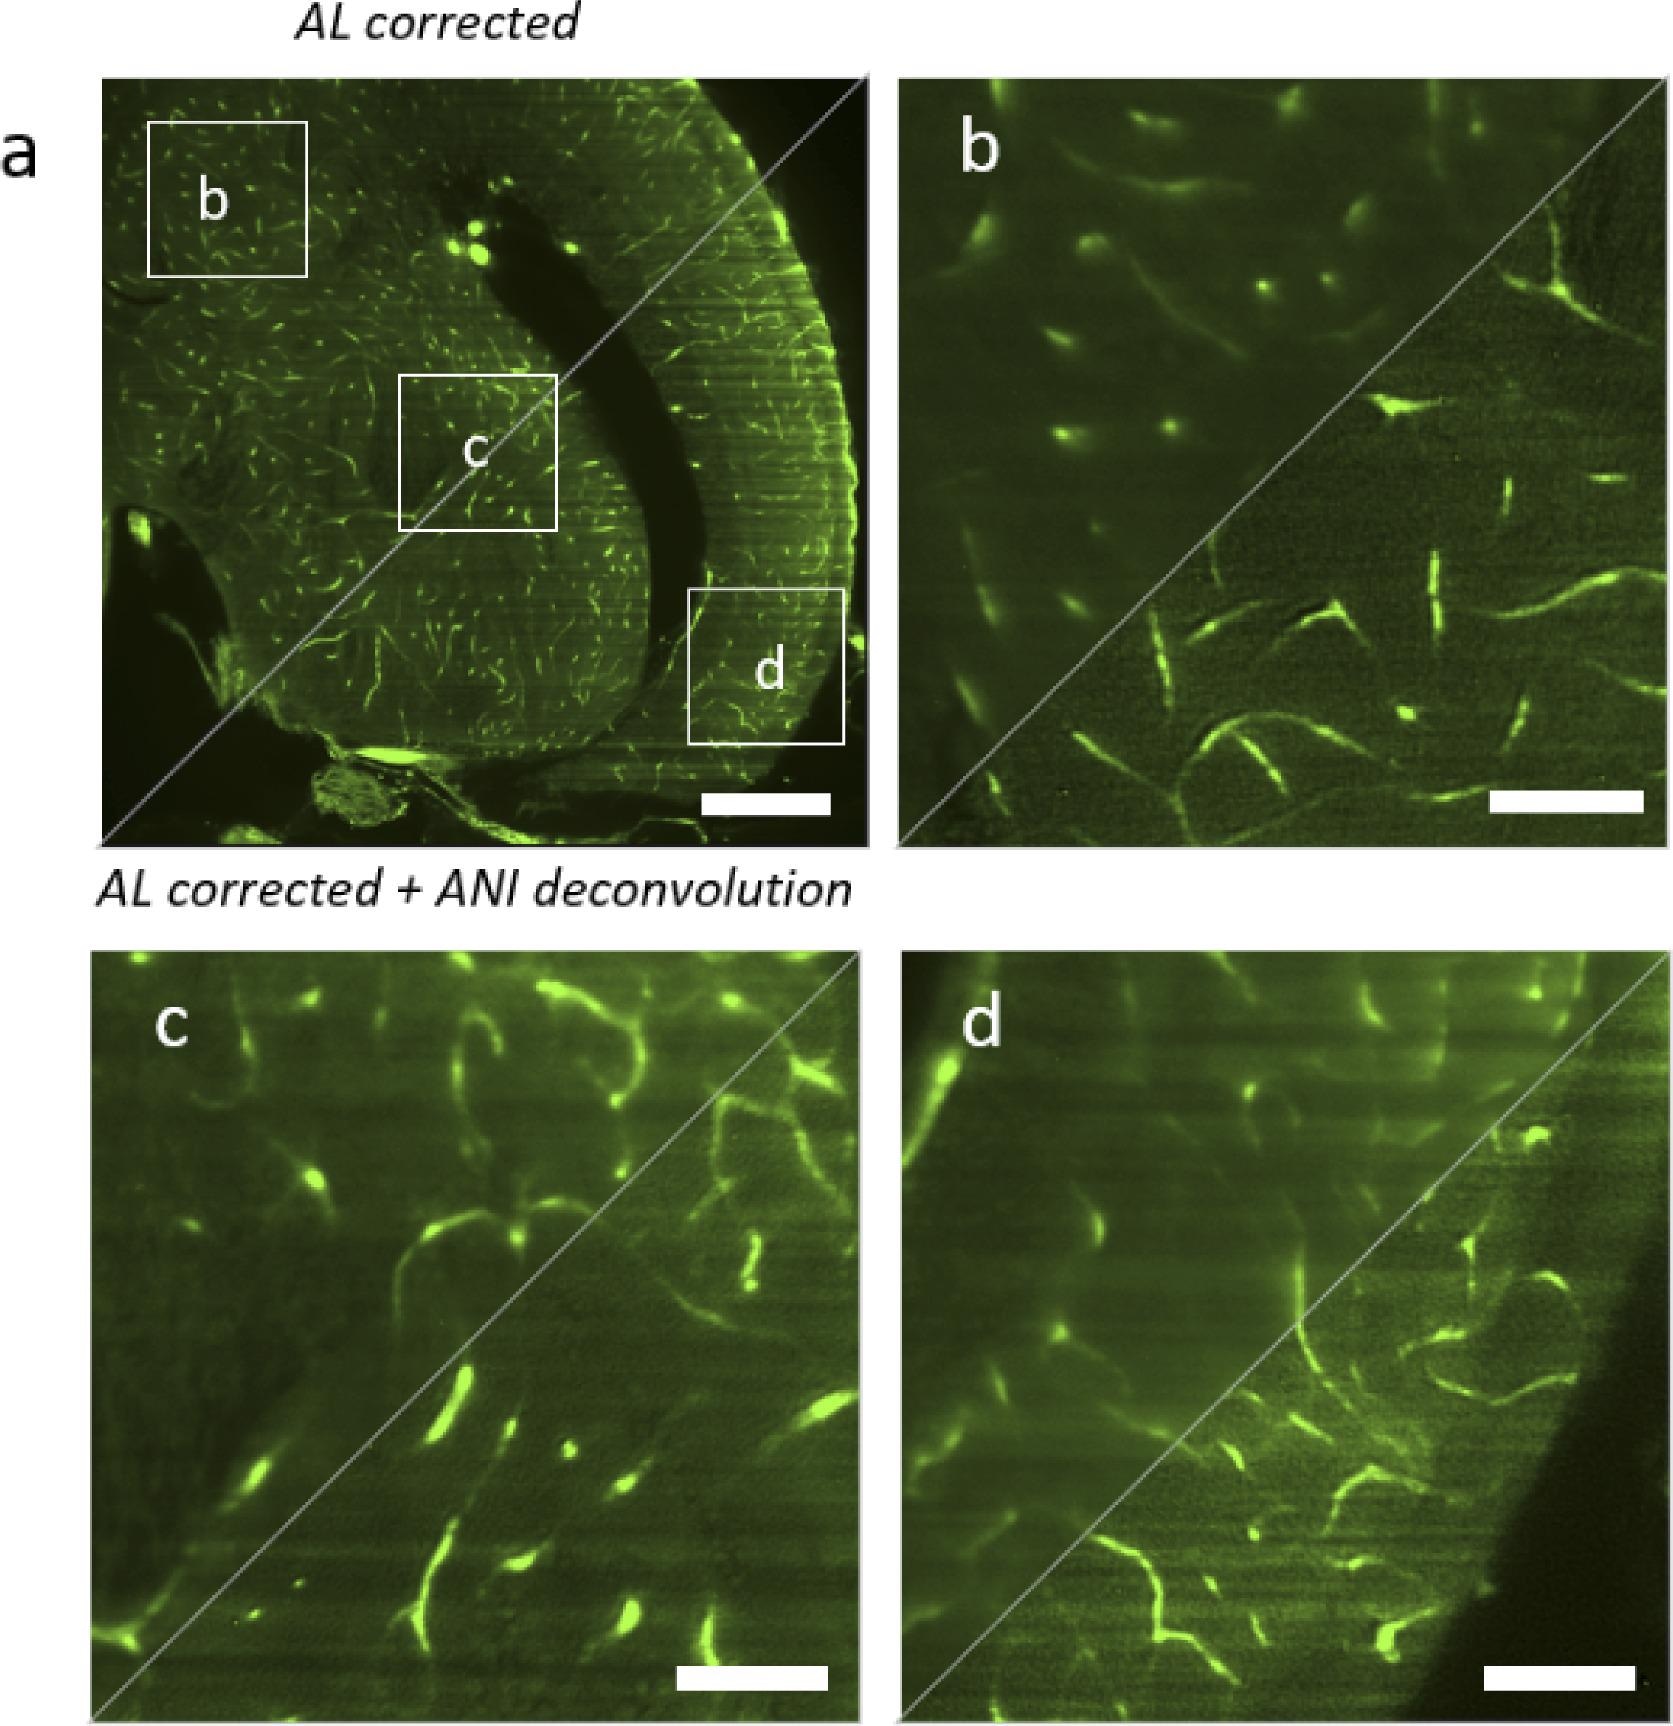
Figure 5. Comparison between hardware correction with adaptive lens (AL) and the combination of hardware correction with anisoplanatic deconvolution (ANI). AL corrected is shown in the top left triangles, AL corrected with ANI deconvolution is shown in the bottom right triangle. (a) Full image of a zebrafish brain plane (b) Magnified region in the top left corner. (c) Magnified region in the center. (d) Magnified region in the bottom right corner. Scalebar is 200 µm in a and 50 µm in b–d. Image Credit: Furieri, et al., 2022
In high contrast and high-resolution reconstruction, knowing region-dependent aberrations and anisoplanatic deconvolution is essential.
Methodology
Researchers employed a Multi Actuator adaptive lens, which depends on piezoelectric actuators to bend ultrathin glass membranes. The wavefront-measuring method consists of a spinning wheel that scans the pupil with a 2.5 mm iris as it rotates. Wavefront measurement was also applied to identify the deformable lenses employed in the closed-loop control system.
The characterization was carried out by individually probing each actuator and recording the wavefront deformation in a matrix, also called an influence functions matrix.
The image was created with a CMOS camera with a field of view of around 11 mm × 11 mm using the objective, a tube lens, and a long pass filter.
The overlapping sections of the tiles were averaged by calculating the number of tile contributions in every single pixel to recreate the image. The anisoplanatically deconvolved picture is reconstructed as a result of this.
Fixation by perfusion was used to determine the source of the moderate/high autofluorescence obtained at the brain level. The lack of autofluorescence in the brain (not shown) was seen using light-sheet fluorescence microscopy, demonstrating that autofluorescence was obtained from blood-containing brain vessels.
Conclusion
Importantly, as compared to pure computational approaches, the combined strategy of employing hardware and computational correction results in a significant improvement in picture quality and a reduction in artifacts.
Finally, the current study reveals that integrated SPAM and deformable lens module may be easily installed on various types of microscopes to measure and correct aberrations.
Journal Reference:
Furieri, T., Ancora, D., Calisesi, G., Morara, S., Bassi, A., Bonora, S., (2022) Aberration measurement and correction on a large field of view in fluorescence microscopy. Biomedical Optics Express, 13(1), pp. 262–273. Available Online: https://www.osapublishing.org/boe/fulltext.cfm?uri=boe-13-1-262&id=465839.
References and Further Reading
- Ertürk A & Bradke F (2013) High-resolution imaging of entire organs by 3-dimensional imaging of solvent cleared organs (3DISCO). Experimental Neurology, 242, pp. 57–64. doi.org/10.1016/j.expneurol.2012.10.018.
- Chung K., et al. (2013) Structural and molecular interrogation of intact biological systems. Nature, 497(7449), pp. 332–337. doi.org/10.1038/nature12107.
- Kaufmann, A., et al. (2012) Multilayer mounting enables long-term imaging of zebrafish development in a light sheet microscope. Development, 139 (17), pp. 3242–3247. doi.org/10.1242/dev.082586.
- Tomer, R (2015) SPED light sheet microscopy: fast mapping of biological system structure and function. Cell, 163(7), pp. 1796–1806. doi.org/10.1016/j.cell.2015.11.061.
- Ji, N (2017) “Adaptive optical fluorescence microscopy. Nature Methods, 14(4), pp. 374–380. doi.org/10.1038/nmeth.4218.
- Booth, M J (2014) Adaptive optical microscopy: the ongoing quest for a perfect image. Light: Science & Applications, 3(4), p. e165. doi.org/10.1038/lsa.2014.46.
- Verstraete H. R. G. W., et al. (2017) Wavefront sensorless adaptive optics OCT with the DONE algorithm for in vivo human retinal imaging [Invited]. Biomedical Optics Express. 8 (4), p. 2261. doi.org/10.1364/BOE.8.002261
- Ji, N., et al. (2010) Adaptive optics via pupil segmentation for high-resolution imaging in biological tissues. Nature Methods, 7(2), pp. 141–147. doi.org/10.1038/nmeth.1411.
- Wahl, D. J., et al. (2017) Pupil segmentation adaptive optics for in vivo mouse retinal fluorescence imaging. Optics Letters, 42(7), pp. 1365–1368. doi.org/10.1364/OL.42.001365.
- Bonora, S., et al. (2015) Wavefront correction and high-resolution in vivo OCT imaging with an objective integrated multi-actuator adaptive lens. Optics Express, 23 (17), p. 2193. doi.org/10.1364/OE.23.021931.
- Pozzi, P., et al. (2020) Plug-and-play adaptive optics for commercial laser scanning fluorescence microscopes based on an adaptive lens. Optics Letters, 45 (13), pp. 3585–3588. doi.org/10.1364/OL.396998.
- Banerjee, K., et al. (2018) Optofluidic adaptive optics. Applied Optics, 57 (22), pp. 6338–6344. doi.org/10.1364/AO.57.006338.
- Skorsetz, M., et al. (2016) Performance evaluation of a sensorless adaptive optics multiphoton microscope. Journal of Microscopy. 261(3), pp. 249–258. doi.org/10.1111/jmi.12325.
- Laslandes, M., et al. (2017) Increasing the field of view of adaptive optics scanning laser ophthalmoscopy. Biomedical Optics Express, 8(11), p. 4811. doi.org/10.1364/BOE.8.004811.
- Popovic, Z., et al. (2012) Dual conjugate adaptive optics prototype for wide field high resolution retinal imaging in Adaptive Optics Progress (IntechOpen), pp. 3–22.
- Pozzi, P., et al. (2022) Anisoplanatic adaptive optics in parallelized laser scanning microscopy. Optics Express, 28(10), p. 14222. doi.org/10.1364/OE.389974.
- Žurauskas, M., et al. (2019) IsoSense: frequency enhanced sensorless adaptive optics through structured illumination. Optica, 6 (3), pp. 370–379. doi.org/10.1364/OPTICA.6.000370.
- Ancora, D., et al. (2021) Spinning pupil aberration measurement for anisoplanatic deconvolution,” to be published in Optics Letters, 46(12), pp. 2884–2887. doi.org/10.1364/OL.427518.
- Tyson, R K (2009) Introduction to Adaptive Optics (SPIE).
- Olarte, O E (2018) Light-sheet microscopy: a tutorial. Advances in Optics and Photonics, 10(1), pp. 111–179. doi.org/10.1364/AOP.10.000111.
- Ragazzoni, R (2000) Adaptive-optics corrections available for the whole sky. Nature, 403 (6765), pp. 54–56. doi.org/10.1038/47425.
- Li, J (2015) Conjugate adaptive optics in widefield microscopy with an extended-source wavefront sensor. Optica, 2(8), p. 682. doi.org/10.1364/OPTICA.2.000682.
- Mertz, J (2015) Field of view advantage of conjugate adaptive optics in microscopy applications. Applied Optics, 54(11), pp. 3498–3506. doi.org/10.1364/AO.54.003498.
- Rajaeipour, P., et al. (2020) Extended field-of-view adaptive optics in microscopy via numerical field segmentation. Applied Optics, 59(12), pp. 3784–3791. doi.org/10.1364/AO.388000.
- Maiuri, L., et al. (2016) Virtual unfolding of light sheet fluorescence microscopy dataset for quantitative analysis of the mouse intestine. Journal of Biomedical Optics, 21, p. 056001. doi.org/10.1117/1.JBO.21.5.056001.
- Ertürk, A (2012) Three-dimensional imaging of solvent-cleared organs using 3DISCO. Nature Protocols, 7(11), pp. 1983–1995. doi.org/10.1038/nprot.2012.119.