In today’s renewable energy production, photovoltaic (PV) devices play a very important role. PV technology can be divided into three different types of PV cells, such as thin filament amorphous silicon, copper indium gallium selenide, or cadmium telluride; wafer-based crystalline silicon; and a new group of organic PV cells.
At present, studies related to PV technologies are quickly expanding to enhance the efficiency, cost, and material of PV cells, and at the same time, scientists continue to study new and improved equipment for the characterization of PV cells. With recent developments in LED technology, new test and measurement equipment have been made available to researchers to explore next-generation PV cells. Oriel Instruments have developed a new LED-based solar simulator called a new AAA VeraSol, which provides several benefits, compared to other lamp-based AAA solar simulators.
The VeraSol comes with a similar spectral match, temporal stability, irradiance uniformity, and features a filter-free, variable intensity output between 0 and 1 sun. The electrically gated LEDs can be switched on or off within 100 ms, without any need for a mechanical shutter for PV IV characterization. Custom spectral control is obtained across the entire AM1.5G spectrum. In terms of functionally, the LEDs have an extended lamp lifetime, need less mechanical cooling, and use less power, further simplifying the system.
The absence of extra radiant heat helps to eliminate artifacts that are related to heating of the PV cells under analysis. In contrast to lamp-based technology, the VeraSol provides an equally and more diverse solar illumination source for characterization and testing of PV cells. This article compares the IV sweep results of the LED- based Oriel VeraSol solar simulator to a Xenon lamp-based solar simulator. The spectral outputs of these simulators are discussed and the IV response is compared for a range of PV cells such as:
- Polycrystalline silicon
- Thin film amorphous silicon
- Monocrystalline silicon
- Thin film copper indium gallium selenide
Basic parameters characterizing an IV curve were produced using ORIEL PVIV software: open circuit voltage (Voc), short circuit current (Isc), efficiency (η), and fill factor (FF).
Background
Spectral Match
A solar simulator is capable of imitating light incident from the sun. Three proven spectra standards are acknowledged when matching the sun’s irradiance spectrum with solar simulators: AM1.5D, AM0, and AM1.5G. AM1.5D is the direct component of the irradiance striking the surface of the Earth; AM0 is the irradiance beyond the atmosphere of the Earth; and AM1.5G accounts for diffuse and direct radiation striking the surface of the Earth.
Most of the solar simulators rely on Xenon lamp light sources, which are filtered optically to match the most commonly represented spectrum, AM1.5G. While the approach of reproducing the sun has been shown to be useful to determine PV cells, it has a restricted lifetime, cannot amend the spectral output, and generates a large amount of heat during the course of test illumination at one sun. The LED-based Oriel VeraSol solar simulator is at the forefront of illumination technology. New developments in LED technology have enabled full spectral coverage between 400 and 1100 nm to correspond with the AM1.5G spectrum for Class A, which happens to be the highest rating for solar simulator spectral match.
The VeraSol compares the overall irradiance of the spectra by integrating from 400 to 1100 nm, and offers a closer spectral match to the AM1.5G spectrum, as opposed to the lamp-based instrument (Figure 1).
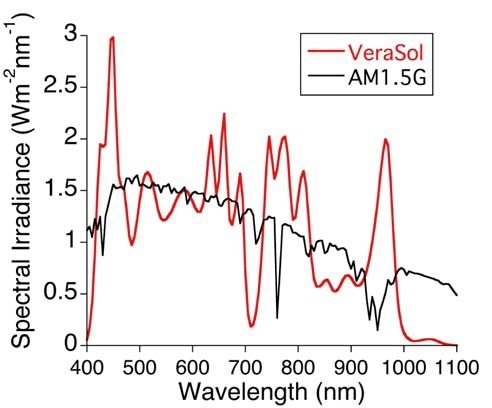
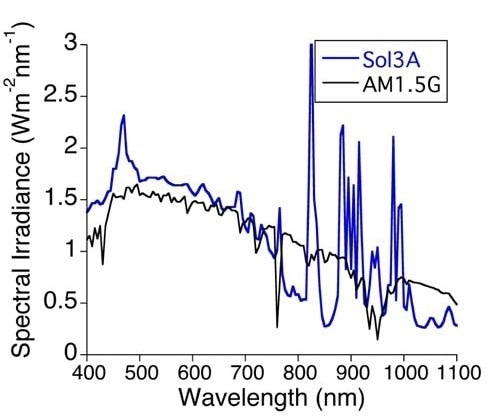
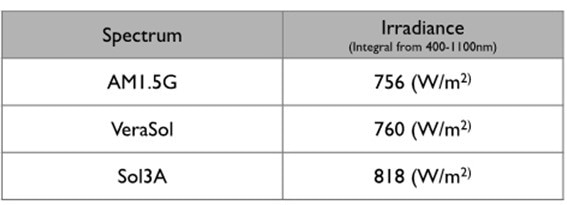
Figure 1. Spectral match of the VeraSol and Sol3A to the AM1.5G spectrum. The table indicates the total irradiance beneath the curve for all three spectra that are the integral spectra over 400-1100 nm.
Using the VeraSol solar simulator, this match can be additionally modified to accurately compare with other spectra comparisons or separate certain spectral regions of interest.
IV Curve Background
PV cells are large PN junctions that produce electricity when light absorption imparts energy to individual electron hole pairs inside a cell. When there is no light, a PV cell can be designed as a current source along with a diode. In a voltage or current characteristic (IV), produced by a voltage sweep of a diode with a source meter, the current is exponentially associated with an applied voltage. Figure 2 shows a simple, similar circuit model for a PV cell that uses the model described above, together with extra series and parallel shunt resistance. Plotting the IV curve in the initial quadrant (Figure 3) is acquired by subtracting the diode current from the photoelectric current (IL). This initial quadrant is helpful to present and determine a power curve (P=VI).
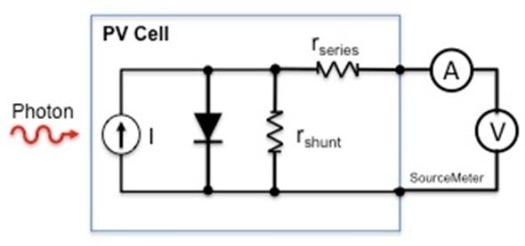
Figure 2. A simple diode circuit model describing a PV cell connected to a source meter for PVIV testing.
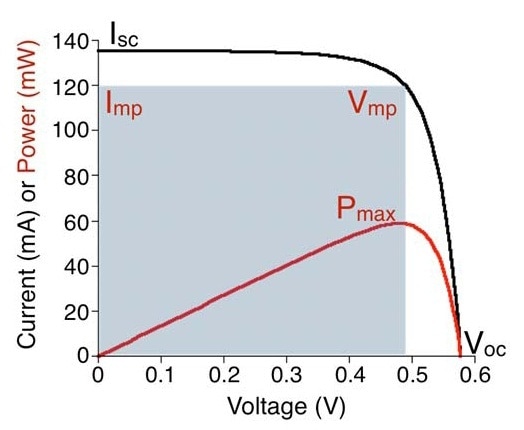
Figure 3. A sample IV curve taken from a monocrystalline silicon PV cell (4cm2) using the Oriel PVIV Kit.
The shunt resistance is associated with manufacturing defects that can amplify the rate of junction shorting or recombination, which together can reduce the optimal flow of current via the solar cell.
The series resistance (Rseries) is the ability of current to travel via the solar cell layers, and is controlled by resistances related to the metal/silicon contacts, semiconductor layers, and metal on the back and front surfaces. The IV characteristic of the PV cell can be better described with more accurate models, but this model integrates the key components required for an initial characterization. Important data regarding operating parameters and internal resistances can be obtained from light stimulated and dark sweep IV curves.
During dark sweep experiments, the required energy is supplied by an external voltage to produce electron hole pairs, which arise from the current flow between the solar cell and the metal contacts. This imitates a diode response. In the case of light stimulated experiments, additional energy is supplied by light to produce electron hole pairs inside the cell. This leads to an increased current (IL) flow out of the solar cell via the metal contacts. Due to small fluctuations in light intensity, the dark sweep IV has less noise. Since all of the current arises from the metal contacts, the estimates of series resistance are usually lower in the case of dark sweep experiments.
In both sets of experiments, the slope of the curve at higher voltages and the slope of the curve at low voltages estimate the series resistance and the shunt resistance, respectively. Plotting the IVs can be done on a semi log plot to clearly isolate these two discrete regions in the waveform. The light stimulated IV and the dark sweep IV provide identical data regarding the solar cell’s diode properties.
The PV cell efficiency (η) represents the ratio of power output of a PV cell to the incident light power (Pout/Pin). It is the most popular and basic value utilized to characterize a PV cell and can be measured from four parameters. These parameters are measured from a single light stimulated IV curve: the short circuit current (Isc), the voltage at maximum power (Vmp), the open circuit voltage (Voc), and the current at maximum power (Imp) (Figure 3).
Voc and Isc are the highest voltage and current obtained by a solar cell and these are defined by the intercepts on the x and y-axis, in that order. The power generated by the solar cell is zero (Figure 3) at both of these operating points. At the maximum power point, the voltage (Vmp) and current (Imp) define the characteristic resistance (Rch) as well as the optimal operating conditions for a solar cell. The fill factor (FF) is the ratio of the rectangular area (Vmp x Imp) from the maximum power point to the rectangular area generated by Voc x Isc. The efficiency represents the ratio of the maximum power output to the input power created by the light source, upgraded to the area of the cell under analysis.
Measurement Setup
As part of the standard test conditions used to define the efficiency of a PV cell, measurements have to be made at an intensity of 1 sun (1000 W/m2), at a spectral match of AM1.5G, and at a temperature of 25°C. The uniformity of irradiance, spectral match, and temporal stability of the irradiance are utilized to grade the performance of commercially available solar simulators. The LED-based VeraSol Class AAA and the Xenon lamp-based Oriel Sol3A Class AAA were employed to match the AM1.5G spectrum. These devices are optimized to produce light at the preferred one sun, and both enable a set of intensities between 0.1 and 1.0 suns. Samples are preserved at 25°C ± 1°C.
When it comes to lamp-based solar simulators, temperature is a major issue because the lamp emits heat, which is transferred onto the sample. However, this is not a major issue in the case of LED-based simulators because LEDs generate minimal amount of heat. A temperature-regulated stage can be used to regulate the temperature of the device under test (DUT); AM1.5G light in this stage can be equilibrated before conducting the IV experiment.
Results: VeraSol vs. Lamp IVs
IV sweeps were carried out on a wide range of thin film and silicon solar cells. For each cell, numerous curves were taken and each time the leads were again positioned to manage differences occurring during contact with the PV cell. Equivalent light intensities between the two light sources were compared by matching short circuit currents. Efficiency, short circuit current, and open circuit voltage were determined to measure the obvious variations between both light sources. The band gap was approximately 1127 nm for silicon, and energy is absorbed by monocrystalline silicon PV cells across the whole VeraSol and Sol3A spectra.
Though the Sol3A and VeraSol spectra were not similar, they match the overall irradiance from 400 to 1100 nm. Comparison of a calibrated, monocrystalline silicon PV cell (Oriel Part Number: 91150 V) was done by matching the 1 sun short circuit current for the two light sources (Figure 4).
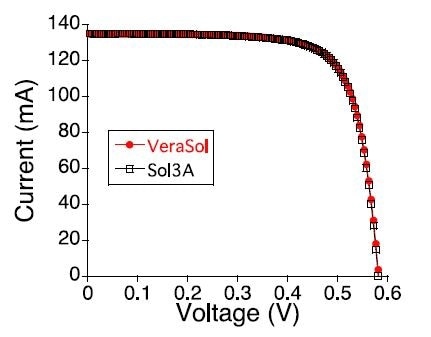
Figure 4. VeraSol and Sol3A 1 sun IV curves from the calibrated monocrystalline silicon PV cell (number).
The IV curve was overlapped after matching the parameter estimates (Figure 4). The chart given below compares the Isc, Voc, and efficiency between the VeraSol and Sol3A.
Newport Calibrated Cell
| |
Efficiency (%) |
Voc (V) |
Isc (mA) |
| VeraSol |
14.57 ± 0.01 |
0.5818 ± 0.0001 |
135.00 ± 0.04 |
| Sol3A |
14.67 ± 0.04 |
0.5810 ± 0.0004 |
135.00 ± 0.13 |
The +/- suggests the standard error of the mean (sem), denoting the difference in the measurements from the true mean. The VeraSol shows a lower difference about the mean from test to test than it does for the lamp-based version. Comparable results were acquired for textured/glass covered silicon nitride PV cells, monocrystalline silicon nitride AR coated PV cells, and a multicrystalline PV cell.
cSi-Silicon Nitride AR Coating
| |
Efficiency (%) |
Voc (V) |
Isc (mA) |
| VeraSol |
15.26 ± 0.004 |
0.613 ± 0.0004 |
180.05 ± 0.10 |
| Sol3A |
15.20 ± 0.084 |
0.608 ± 0.0005 |
180.02 ± 0.05 |
cSI-Glass / Silicon Nitride AR
| |
Efficiency (%) |
Voc (V) |
Isc (mA) |
| VeraSol |
12.54 ± 0.09 |
0.583 ± 0.0001 |
406.38 ± 0.12 |
| Sol3A |
12.53 ± 0.38 |
0.578 ± 0.0005 |
407.24 ± 0.13 |
Multicrystaline Si
| |
Efficiency (%) |
Voc (V) |
Isc (mA) |
| VeraSol |
9.47 ± 0.077 |
0.602 ± 0.0005 |
252.4 ± 0.2 |
| Sol3A |
9.59 ± 0.110 |
0.598 ± 0.0007 |
252.8 ± 0.5 |
To additionally test the uniformity between these two light sources, two thin film PV cells such as an amorphous silicon module and a copper indium gallium selenide (CIGS) were selected with band gaps at about 730 nm and 1133 nm, respectively (Figure 5a and 5b).
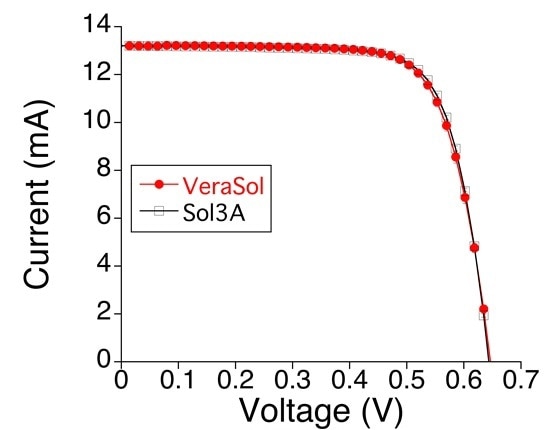
Figure 5a. VeraSol (red) and Sol3A (black) 1.0 sun IV curves from Copper indium gallium thin film PV cell (0.42cm2).
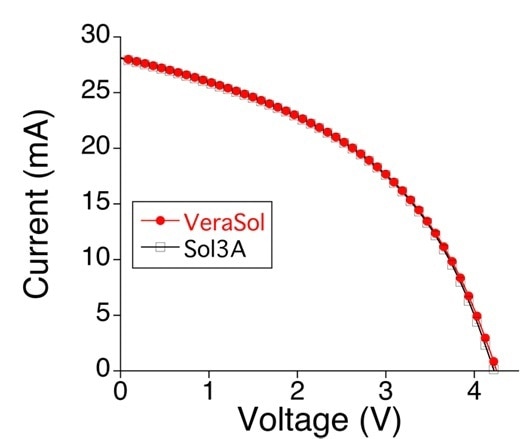
Figure 5b. VeraSol (red) and Sol3A (black) 1.0 sun IV curves from an amorphous silicon thin film module (6.75cm2).
Thin Film CIGS
| |
Efficiency (%) |
Voc (V) |
Isc (mA) |
| VeraSol |
14.63 ± 0.04 |
0.642 ± 0.0005 |
13.10 ± 0.01 |
| Sol3A |
14.62 ± 0.08 |
0.639 ± 0.0002 |
13.10 ± 0.01 |
Thin Film Amorphous Si Module
| |
Efficiency (%) |
Voc (V) |
Isc (mA) |
| VeraSol |
2.705 ± 0.001 |
4.243 ± 0.004 |
28.16 ± 0.02 |
| Sol3A |
2.700 ± 0.002 |
4.216 ± 0.007 |
28.09 ± 0.04 |
Similar to the results obtained from the crystalline silicon test, both PV cells created almost similar IV curves and ensuing parameters when comparing the VeraSol to the Sol3A. No major differences were detected in these tests, although results utilizing other materials may show a variation between the two light sources.
Temperature: VeraSol vs. Lamp IVs
The VeraSol has a special feature which allows it to eliminate a large amount of heat from changing the PV cell under test. This is a preferred quality for specific research questions. Solar radiation, further than the band gaps of a material, produces heat that has an additional effect of altering the open circuit voltage of the IV curve. For IV curves produced over a period of 30 minutes, continuous one sun illumination does not move with the VeraSol solar simulator (Figure 6A).
Conversely, the lamp-based simulator promotes a left shift in IV curve in less than 1 minute (Figure 6B). Figure 6C shows the corresponding temperature change of the silicon PV wafer. Due to the VeraSol’s LED design, far-reaching infrared light and high energy light does not contribute to sample heating. In the case of narrow band gap materials, the VeraSol can additionally restrict this heating by removing unnecessary wavelengths.
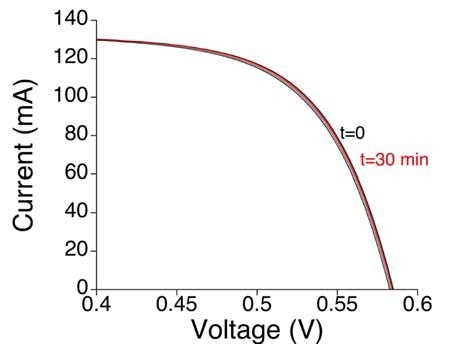
Figure 6a. IV Curves taken at 1, 3, 10, 15, 20, 30 minutes under continuous 1 sun illumination
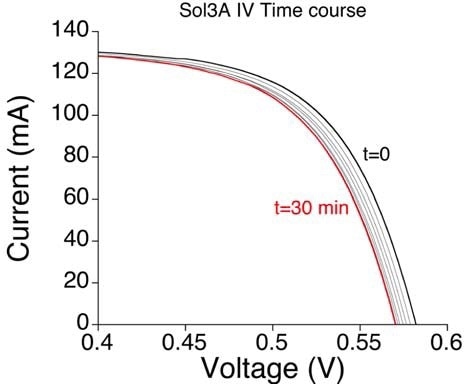
Figure 6b. IV Curves taken at 1, 3, 10, 15, 20, 30 minutes under continuous 1 sun illumination.
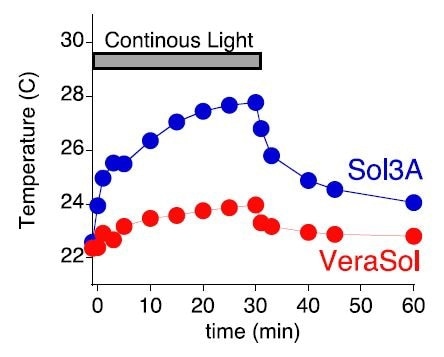
Figure 6c. PV cell temperature for the two experiments in A and B over the 30 minute light exposure as well as a 30 minute recovery with no light.
Conclusion
The spectral variations between the Sol3A and the VeraSol did not impact the IV curve response for the PV cells that were tested. In addition to the close similarity in IV curve responses, the VeraSol generated a more reproducible IV curve from one measurement to another, as was obvious from a lower standard error of the mean values. LED-based technology may create a lower overall discrepancy in spectral irradiance, possibly providing more reliable results. This effect can be measured with additional experiments. Separated spectral control, lower light source heat generation, and enhanced consistency make the LED-based VeraSol a better solar simulator technology when compared to lamp-based technologies.

This information has been sourced, reviewed and adapted from materials provided by Oriel Instruments.
For more information on this source, please visit Oriel Instruments.