Temperature sensing with high spatial and temporal resolution is vital in many industries, including industrial manufacturing, environmental monitoring, and healthcare monitoring. For their distant detection, minimum invasion, tolerance to electromagnetic interferences, and excellent resolution, optical-based sensors provide appealing alternatives in temperature monitoring for biological diagnostics. This article will look at a recent study published in Light: Science & Applications.
Image Credit: Joyseulay/Shutterstock.com
Thermal sensors based on optical cavities have extremely high precision spectrally resolved optical responses, but their measurements need complex spectrometric systems in stable fixtures, which restricts their biological uses.
Temperature-dependent color variations are also evident in phase-changing materials such as liquid crystals, although their apparent color might be limited by the surrounding illumination, viewing angles, polarizations, and other factors.
Photoluminescent (PL) materials or devices can be used to sense temperature, and the emission intensity, peak wavelength, decay lifetime, etc., are dependent on the temperature. Several optoelectronic devices based on designed semiconductor heterostructures have been developed for various optical sensing applications.
This study demonstrated the capability of an optoelectronic upconversion device for thermal sensing, and spatially resolved temperature mapping in ambient environments.
Results
The suggested temperature sensing method is focused on a fully integrated optoelectronic upconversion device, schematically depicted in Figure 1a, comprising of a low-bandgap gallium arsenide (GaAs) based double junction photodiode and a large-bandgap indium gallium phosphide (InGaP) based light-emitting diode (LED) arranged in series.
The device structure, which was formed on a GaAs substrate with a sacrificial interlayer, is shown in Figure 1b as a cross-sectional scanning electron microscopy (SEM) picture.
The PL emission of the devices is temperature dependent. Figure 1d shows the device’s spectroscopic performance under steady-state NIR excitation at 770–830 nm.
Figures 1e shows device performance data from ten distinct devices.
These experimental results are quantitatively consistent with theoretical calculations based on a comprehensive diode balancing model and the empirical Varshni formula for the bandgap energy-temperature connection.
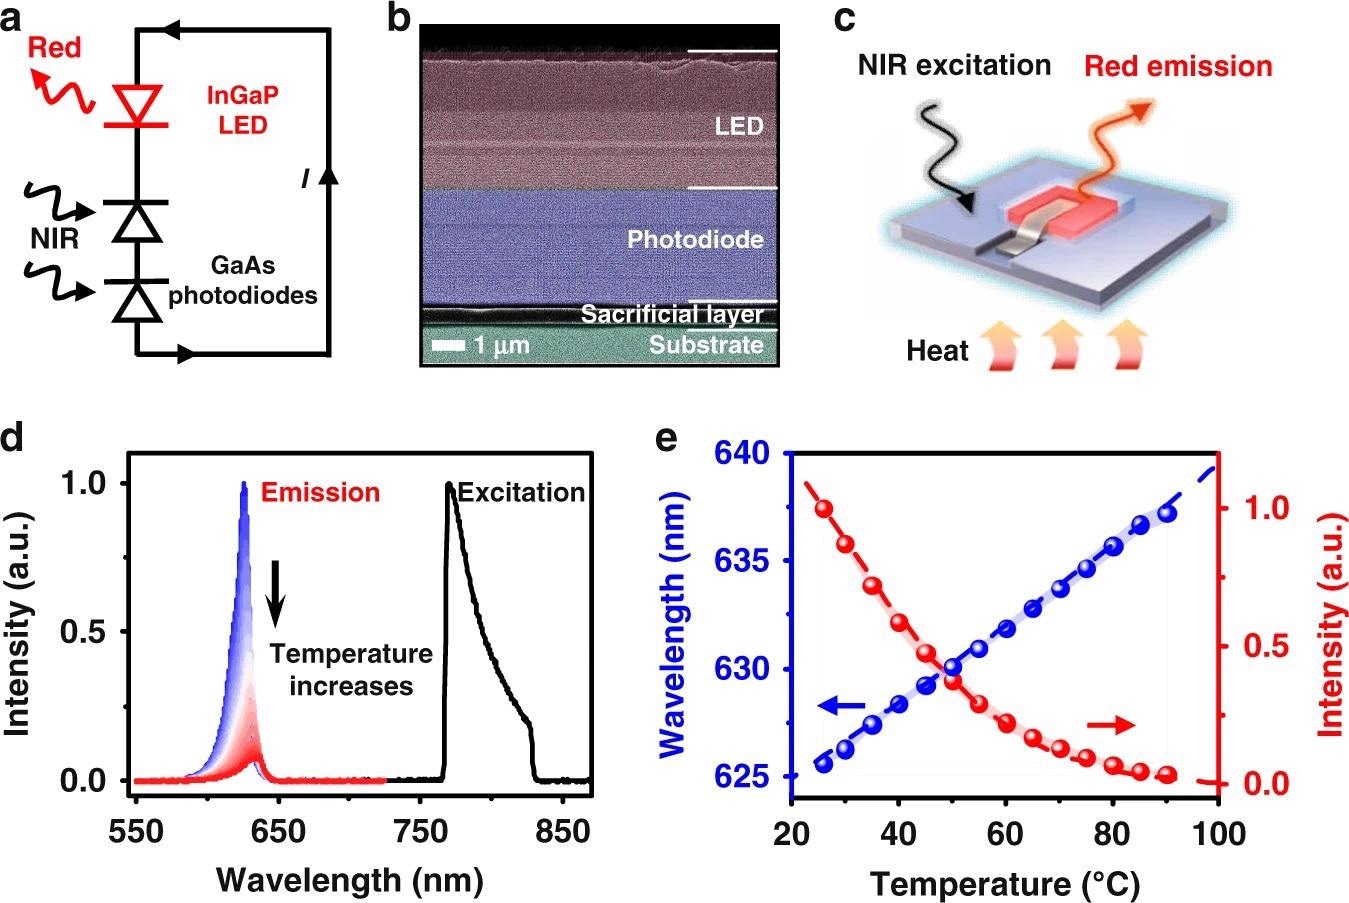
Figure 1. An optoelectronic upconversion device with temperature dependent light emission. a Circuit diagram and (b) Scanning electron microscopic (SEM) image of the optoelectronic upconversion design, including an InGaP red LED and a GaAs double junction photodiode with serial connection. c Schematic diagram of the upconversion device for temperature sensing. d Spectra of the excitation and the upconverted photoluminescence (PL) emission at varied temperatures (25–90 °C). e Calculated (dash line) and measured (dots) peak wavelength and PL intensity of the upconverted red emission as a function of temperature, and the shaded range represents the standard deviation measured among 10 samples. Image Credit: Ding, H, et al., 2022
The study examines the attributes of different electrical components in conjunction with the device structure to gain a better understanding of the upconversion device’s temperature sensing process.
They made microscale InGaP LEDs (Figure 2a) and GaAs photodiodes (Figure 2d) and compared their thermal characteristics.
The external quantum efficiency (EQE) spectra of the double junction GaAs photodiode are shown in Figure 2e. Due to the decreased bandgap of GaAs, the optical absorption edge redshifts as temperature rises.
The photocurrent mismatch within the double junction photodiode at increased temperatures causes the EQE maximum to diminish and the spectral peak to shift to longer wavelengths (Figure 2f). The efficiency decreases for all devices are summarized in Figure 2g (LED, photodiode, and the upconversion device).
The current–voltage characteristics of the LED and photodiode are shown in Figure 2h at temperatures ranging from 25 °C to 90 °C.
The operating conditions of both devices are defined by the crossing points of the current–voltage curves in Figure 2h, which are displayed in Figure 2i. The crossing locations of the current–voltage curves are influenced by a variety of factors, including the device construction and excitation circumstances.
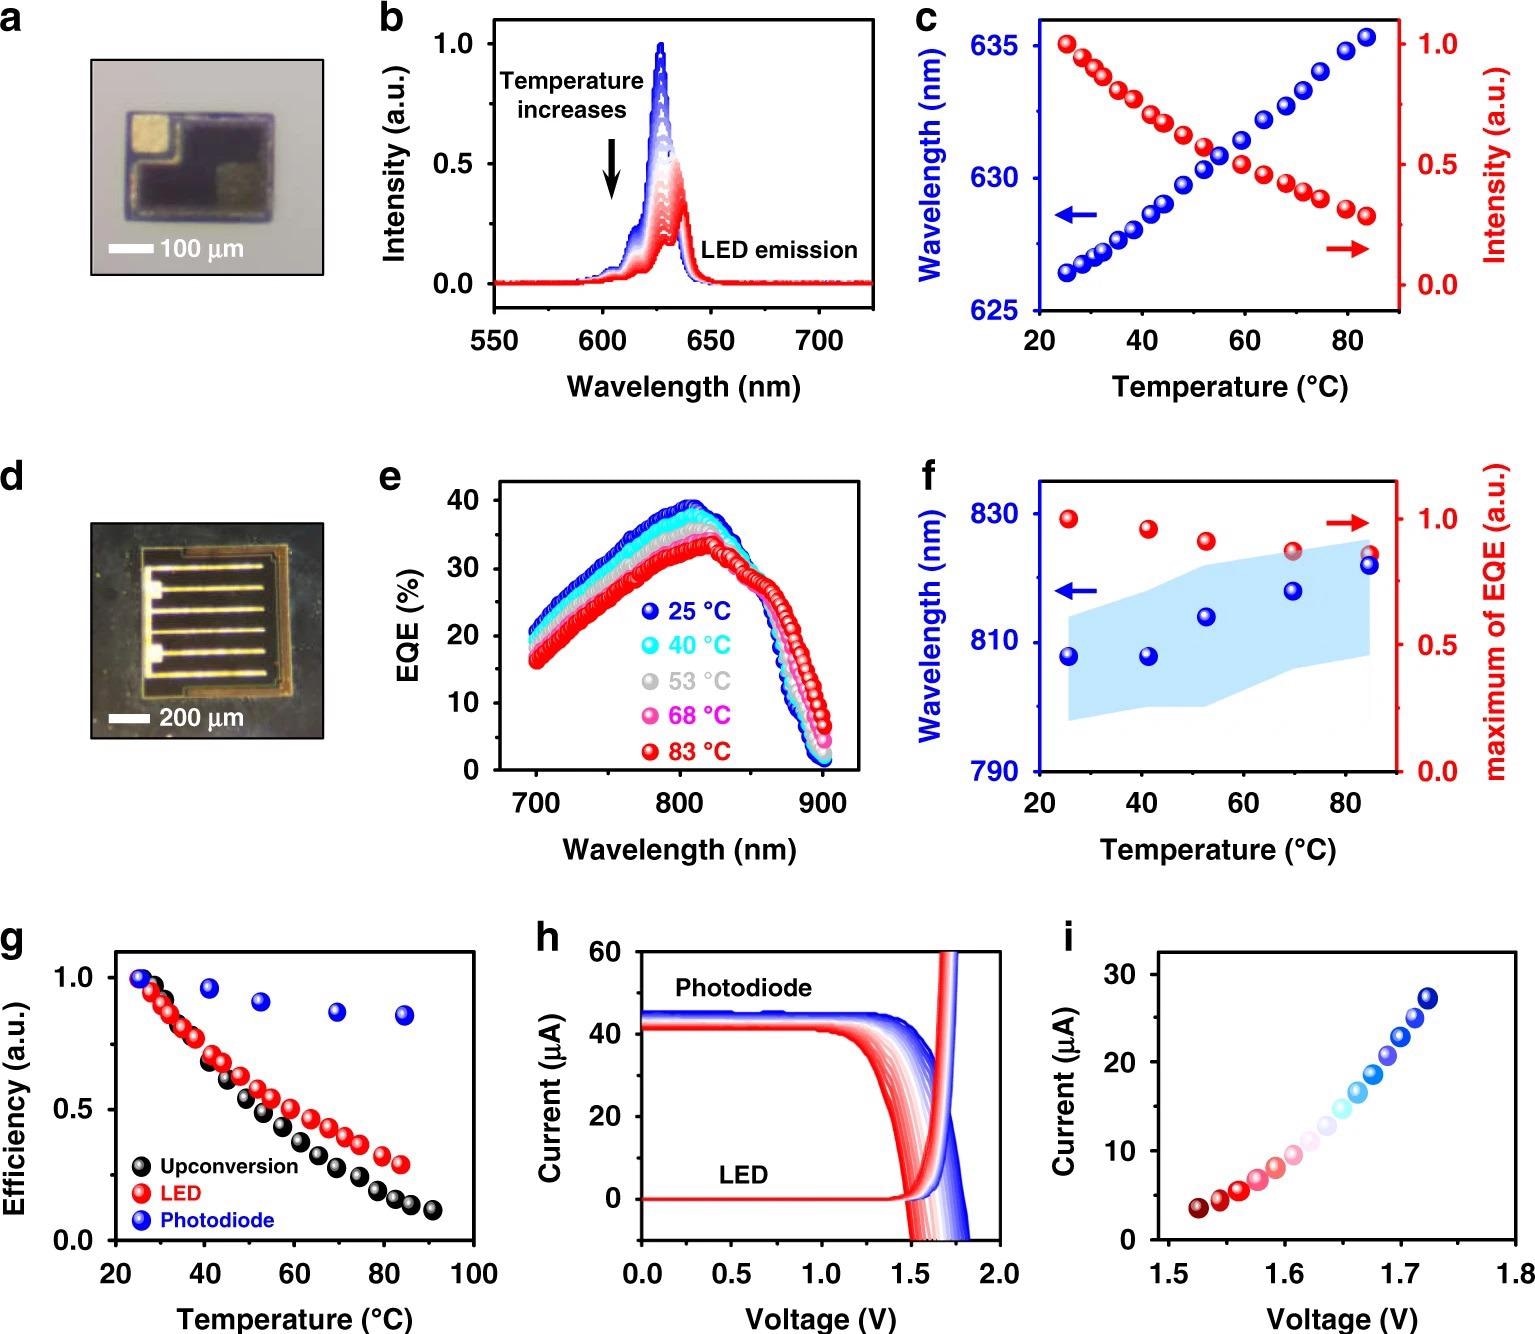
Figure 2. Thermal behaviors of individual InGaP LED and GaAs photodiode. a Micrograph of an InGaP LED. b Electroluminescence (EL) spectra of the InGaP LED at varied temperatures (25–90 °C), with an injected forward current of 20 µA. c EL intensity changes (red dots) and peak wavelength shifts (blue dots) for the InGaP LED at different temperatures. d Micrograph of a double junction GaAs photodiode. e External quantum efficiency (EQE) spectra of the GaAs photodiode at different temperatures. f Peak absorption intensity changes (red dot) and peak wavelength shifts (blue dot) of the GaAs photodiode at different temperatures. The shaded blue region is the wavelength range where the absorption intensity is above 98% of the peak. g Summary of efficiency results, including PL of the upconversion device, EL of the LED, and EQE of the photodiode at varied temperatures (25–90 °C). h Current–voltage curves of the InGaP LED and the GaAs photodiode (under irradiance 40 mW cm−2, 810 nm) at varied temperatures from 25 °C (blue) to 90 °C (red). i Values of current and voltage at the intersection points in h, indicating the corresponding working conditions of the optoelectronic upconversion device. Image Credit: Ding, H, et al., 2022
Figure 3a shows a completely constructed device with PL mappings captured with a tiny camera at different temperatures.
The related relationship between PL intensity (measured by counting the average number of recorded photons using an image sensor) and temperature is plotted in Figure 3b, and the pattern is identical to that seen with a spectrometer (Figure 1e).
Figures 3c and d show the device’s dynamic reaction throughout a cyclic heating/cooling operation (between 26 °C and 38 °C) or a step increase at different temperatures.
A device array (size ~2 cm2, with ~1500 devices) is created to demonstrate the capacity of spatially resolved heat sensing (Figure 3e).
The intensity-temperature calibration achieved in Figure 3b can be used to quantify the visible thermal maps.
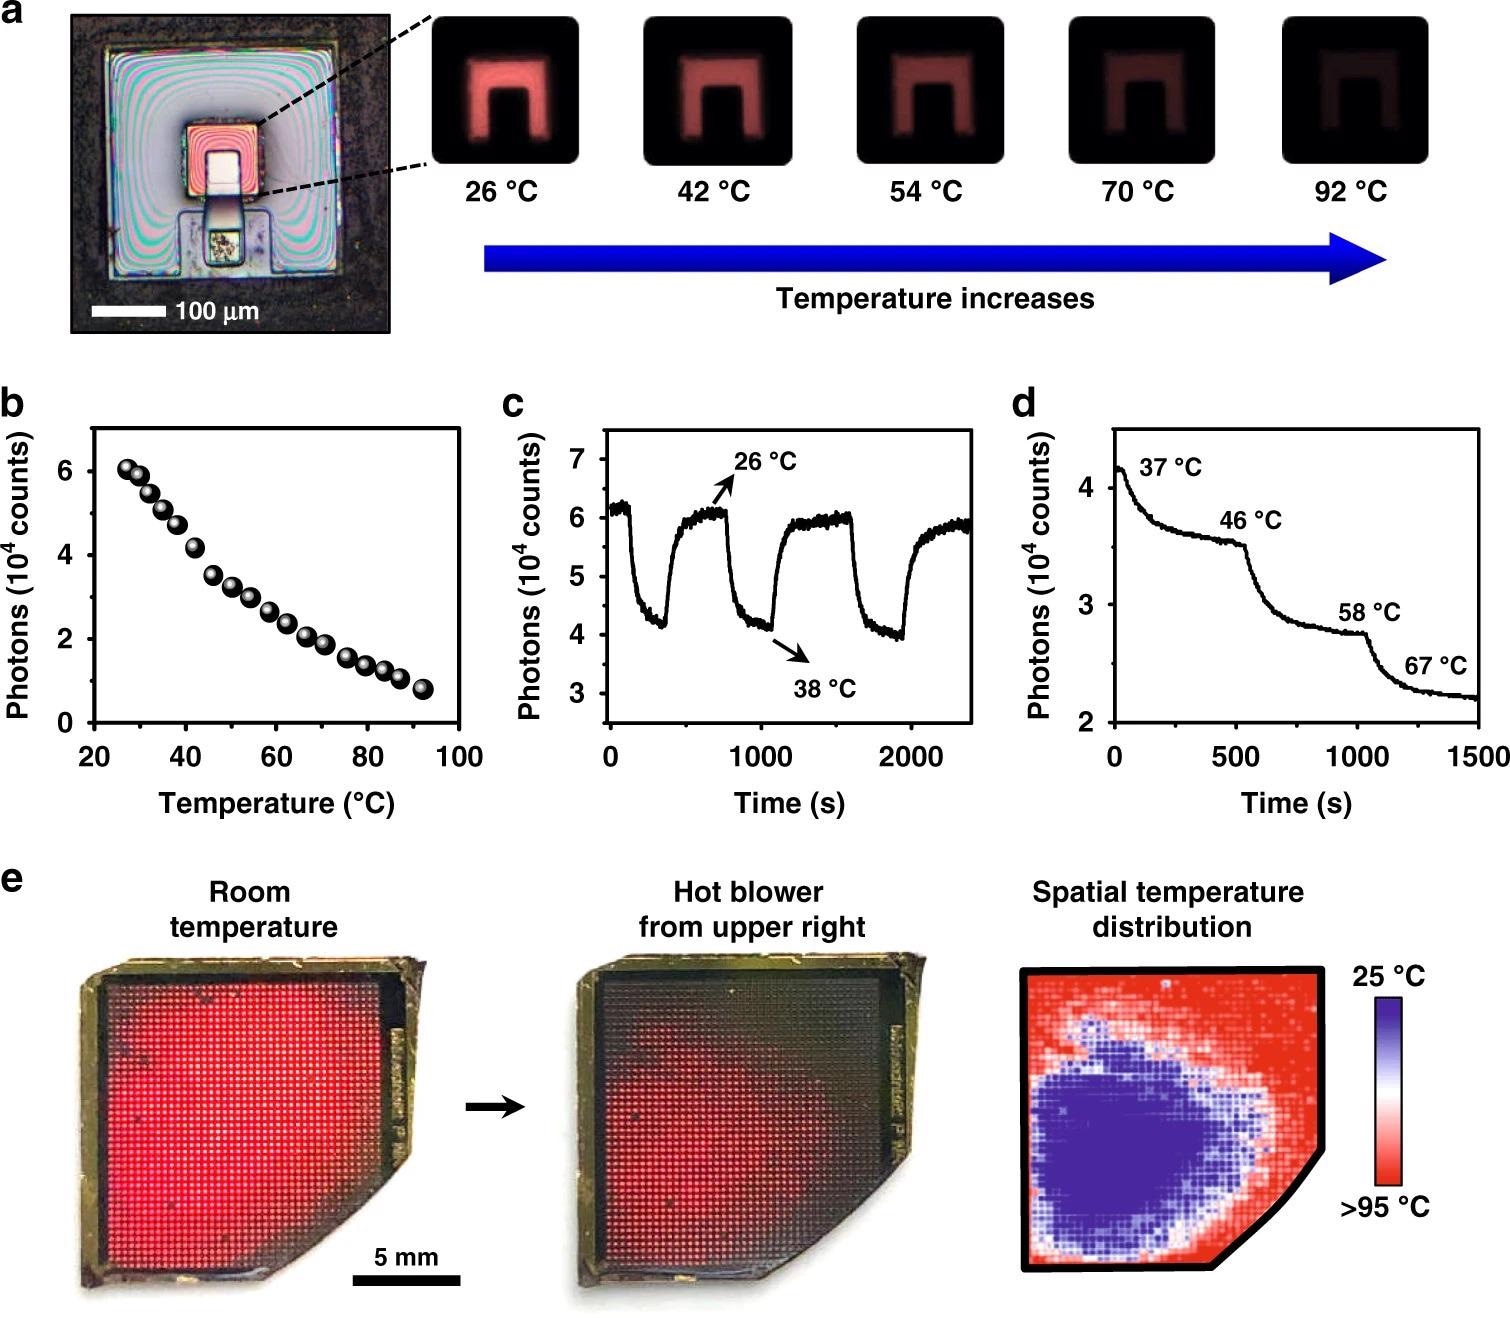
Figure 3. Dynamic thermal sensing and mapping based on the upconversion devices. a Microscopic images show PL emissions of an optoelectronic upconversion device, with the intensity changing with the temperature from 26 °C to 92 °C. b Relation of PL intensity versus temperature. c Cycled temperature test of the device repeatedly changes from 26 °C to 38 °C. d PL intensity of the device responding to step-tuned temperature changes. e Spatially resolved PL responses of a device array at room temperature (left) and under nonuniform heating (middle). Right: the corresponding temperature mapping. Image Credit: Ding, H, et al., 2022
A thin-film, freestanding device can be integrated with fiber optics to form light-guided thermal sensors (Figure 4a).
Figure 4b shows the setup for fiber-based temperature detection, which includes a spectrometer and an NIR excitation LED (810 nm) coupled to the two branches of a Y-shaped fiber terminated with our upconversion fiber.
Both curves correspond well with the data obtained by a colocalized thermocouple, with R2 = 0.90 determination coefficients, as shown in Fig. 4e.
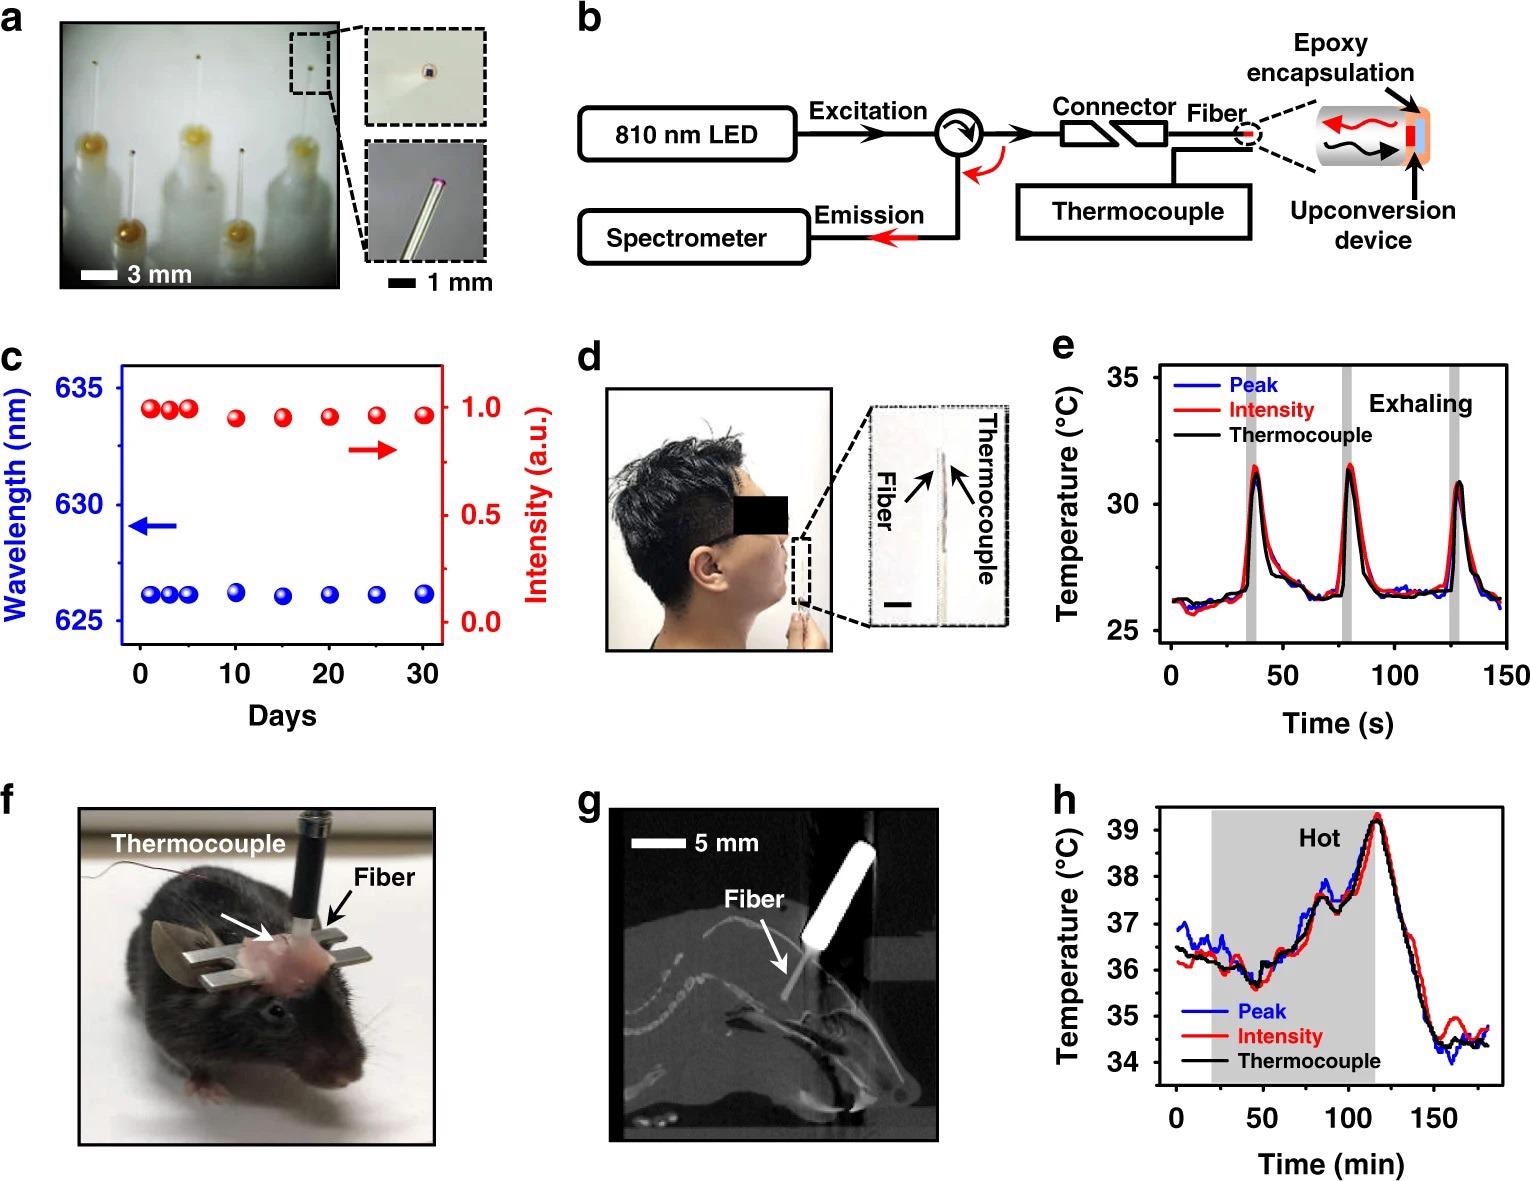
Figure 4. Optoelectronic upconversion devices integrated with fiber optics for in vivo temperature sensing. a Photographs of upconversion devices transferred on the tips of silica fibers (diameter ~600 µm). Enlarged boxes present a zoomed-in view of the fiber tip with a red-emitting device excited by the coupled near-infrared light. b Schematic illustration of the temperature sensing setup for spectral analysis, mainly including an 810 nm LED source, a spectrometer, and a Y-shaped fiber, as well as a thermocouple for temperature calibration. c Chronic PL stability of the encapsulated fiber sensor immersed in PBS for different times at room temperature (~25 °C), in which both the peak wavelength and PL intensity are recorded. d Photograph of the exhaling temperature detection with the fiber sensor. e Dynamic temperature signals during cycled exhaling activities obtained by the fiber sensor based on the emission peak wavelength shifts and PL intensity changes, compared with results simultaneously recorded by the thermocouple. The gray regions represent actions of exhaling. f Photograph of a behaving mouse with a fiber sensor and a thermocouple implanted into the brain for temperature sensing. g Sagittal CT reconstruction of a slice, indicating the location of the implanted fiber. h Dynamic temperature signals obtained in the mouse brain by the fiber sensor based on the emission peak wavelength shifts and PL intensity changes, compared with results simultaneously recorded by the thermocouple. The shaded gray region represents the time period when the mouse is placed in a hot environment at around 40 °C. Image Credit: Ding, H, et al., 2022
Thin-film devices utilize use of semiconductor bandgaps and diode junctions’ thermal properties. Figure 4f shows a moving mouse with a fiber sensor and a thermocouple placed by stereotaxic surgery in the same brain area.
The fiber tip is positioned in the hypothalamus, according to the reconstructed x-ray computed tomography (CT) images in Figure 4g. A pulsed NIR light is used to illuminate the upconversion device to reduce the heating effect of the excitation source.
Figures 4h shows the brain temperature measured by the fiber and the thermocouple concurrently during a 3-hour period, and the results show that these optical and electrical readouts are in good agreement with a determination coefficient R2 > 0.97.
Discussion
The study presents an optical thermometer comprising integrated optoelectronic devices for photon upconversion. This thermometer offers high sensitivities and low power excitation, and can be used for localized temperature monitoring in the deep body.
The present device’s red emission (~625 nm), which is beyond the biological transparency window, is one of its drawbacks. In the future, semiconductors could be used for both absorption and emission at longer wavelengths.
These materials and device concepts, when combined together, form a powerful toolkit with numerous applications in the environment and healthcare.
Materials and Methods
The optoelectronic upconversion devices are grown on a GaAs substrate via metal-organic chemical vapor deposition (MOCVD), lithographically patterned by selective wet etching and metallization, and then released from the thermal release tape by heating the tape to 120 °C.
Devices are photographed with an Olympus IX53 microscope and analyzed using an Andor Zyla 4.2Plus CMOS camera or a spectrometer. The temperature is controlled with a ceramic electric heating plate, and the current-voltage characteristics are measured.
For temperature control, samples are put on a ceramic electric heating plate calibrated by a thermocouple. A Keithley 2400 source meter is used to measure the current–voltage characteristics of devices. A typical system collects the EQE spectra of photodiodes (QEX10, PV Measurement). For temperature reference and system calibration, a standard thermocouple (YET-620) with a T-type microprobe is employed.
Tsinghua University’s Institutional Animal Care and Use Committee (IACUC) approved all animal procedures. Adult male C57BL/6 J mice (8–12 weeks old) were acquired from Vital River Laboratory Animal Technology (Beijing, China) and employed and maintained in groups (3–5 mice per cage) under regular circumstances.
The mice were shaved and put in a stereotaxic frame after receiving an intraperitoneal injection of 0.5% sodium pentobarbital (10 mL kg-1) for anesthesia. A fiber sensor is inserted into the hypothalamus and secured to the skull by dental cement.
Journal Reference:
Ding, H., Lv, G., Cai, X. et al. An Optoelectronic thermometer based on microscale infrared-to-visible conversion devices. Light Sci Appl. 11, 130 (2022). https://doi.org/10.1038/s41377-022-00825-5
References and Further Reading
- Childs, P. R. N., et al. (2000) Review of temperature measurement. Review of Scientific Instruments, 71(8), pp. 2959–2978. doi.org/10.1063/1.1305516.
- Oh, Y. S., et al. (2021) Battery-free, wireless soft sensors for continuous multi-site measurements of pressure and temperature from patients at risk for pressure injuries. Nature Communications, 12, p. 5008. doi.org/10.1038/s41467-021-25324-w.
- Liao, J & Yang, L (2021) Optical whispering-gallery mode barcodes for high-precision and wide-range temperature measurements. Light: Science & Applications, 10, p. 32. doi.org/10.1038/s41377-021-00472-2.
- Palmer, T & Stevens, B (2019) The scientific challenge of understanding and estimating climate change. Processing of the National Academy of Sciences of the USA, 116(49), pp. 24390–24395. doi.org/10.1073/pnas.1906691116.
- Duhr, S & Braun, D (2006) Why molecules move along a temperature gradient. Processing of the National Academy of Sciences of the USA, 103(52), pp. 19678–19682. doi.org/10.1073/pnas.0603873103
- Zhu, X. J., et al. (2016) Temperature-feedback upconversion nanocomposite for accurate photothermal therapy at facile temperature. Nature Communications, 7, p. 10437. doi.org/10.1038/ncomms10437.
- Owen, S. F., et al. (2019) Thermal constraints on in vivo optogenetic manipulations. Nature Neuroscience, 22, pp. 1061–1065. doi.org/10.1038/s41593-019-0422-3.
- Shin, J., et al. (2019) Bioresorbable optical sensor systems for monitoring of intracranial pressure and temperature. Science Advances, 5(7), p. eaaw1899. doi.org/10.1126/sciadv.aaw1899.
- Wang, X. D., et al. (2013) Luminescent probes and sensors for temperature. Chemical Society Reviews, 42, pp. 7834–7869. doi.org/10.1039/C3CS60102A
- Del Rosal, B., et al. (2017) In vivo luminescence nanothermometry: from materials to applications. Advanced Optical Materials, 5(1), p. 1600508. doi.org/10.1002/adom.201600508.
- Zhou, J., et al. (2020) Advances and challenges for fluorescence nanothermometry. Nature Methods, 17, pp. 967–980 (2020). doi.org/10.1038/s41592-020-0957-y
- Dramićanin, M D (2020) Trends in luminescence thermometry. Journal of Applied Physics, 128, p. 040902. doi.org/10.1063/5.0014825.
- Vollmer, M & Möllmann, K P (2010) Infrared Thermal Imaging: Fundamentals, Research and Applications. In: John Wiley & Sons, Weinheim. Available at: https://onlinelibrary.wiley.com/doi/book/10.1002/9783527630868.
- Rogalski, A (2012) History of infrared detectors. Opto-Electronics Review, 20, pp. 279–308. doi.org/10.2478/s11772-012-0037-7.
- Tamaoki, N (2001) Cholesteric liquid crystals for color information technology. Advanced Materials, 13(15), pp. 1135–1147. doi.org/10.1002/1521-4095(200108)13:15%3C1135::AID-ADMA1135%3E3.0.CO;2-S.
- Coles, H J & Pivnenko, M N (2005) Liquid crystal ‘blue phases’ with a wide temperature range. Nature, 436, pp. 997–1000. doi.org/10.1038/nature03932.
- Gao, L., et al. (2014) Epidermal photonic devices for quantitative imaging of temperature and thermal transport characteristics of the skin. Nature Communications, 5, p. 4938. doi.org/10.1038/ncomms5938.
- Liu, X. L., et al. (2021) Fast wide-field upconversion luminescence lifetime thermometry enabled by single-shot compressed ultrahigh-speed imaging. Nature Communications, 12, p. 6401. doi.org/10.1038/s41467-021-26701-1.
- Brites, C. D. S., et al. (2019) Lanthanide-based thermometers: at the cutting-edge of luminescence thermometry. Advanced Optical Materials, 7(5), p. 1801239. doi.org/10.1002/adom.201801239.
- Cortese, A. J., et al. (2020) Microscopic sensors using optical wireless integrated circuits. Processing of the National Academy of Sciences of the USA, 117(17), pp. 9173–9179 (2020). doi.org/10.1073/pnas.1919677117.
- Fedotov, I. V., et al. (2020) All-optical brain thermometry in freely moving animals. ACS Photonics, 7(12), pp. 3353–3360. doi.org/10.1021/acsphotonics.0c00706.
- Weissleder, R (2001) A clearer vision for in vivo imaging. Nature Biotechnology. 19, pp. 316–317. doi.org/10.1038/86684.
- Guo, J. J., et al. (2019) Stretchable and temperature-sensitive polymer optical fibers for wearable health monitoring. Advanced Functional Materials, 29(33), p. 1902898. doi.org/10.1002/adfm.201902898.
- Zhang, F (2018) Photon Upconversion Nanomaterials. In: Springer, (Springer, Berlin, 2015) p. 413–416. Available at: https://link.springer.com/book/10.1007/978-3-662-45597-5.
- Xu, M. et al. Ratiometric nanothermometer in vivo based on triplet sensitized upconversion. Nature Communications, 9, p. 2698. doi.org/10.1038/s41467-018-05160-1.
- Chen, G. Y., et al. (2014) Upconversion nanoparticles: design, nanochemistry, and applications in theranostics. Chemical Reviews, 114(10), pp. 5161–5214. doi.org/10.1021/cr400425h.
- Lyapin, A. A., et al. (2018) Infrared-to-visible upconversion luminescence in SrF2:Er powders upon excitation of the 4I13/2 level. Optical Materials Express, 8(7), pp. 1863–1869. doi.org/10.1364/OME.8.001863.
- Zhou, J., et al. (2019) A new generation of dual-mode optical thermometry based on ZrO2:Eu3+ nanocrystals. Nanophotonics, 8(12), pp. 2347–2358. doi.org/10.1515/nanoph-2019-0359.
- Brites, C. D. S., et al. (2016) Instantaneous ballistic velocity of suspended Brownian nanocrystals measured by upconversion nanothermometry. Nature Nanotechnology, 11, pp. 851–856 (2016). doi.org/10.1038/nnano.2016.111.
- Yang, Y., et al. (2011) Semiconductor infrared up-conversion devices. Progress in Quantum Electronics, 35(4), pp. 77–108 (2011). doi.org/10.1016/j.pquantelec.2011.05.001.
- Ding, H., et al. (2018) Microscale optoelectronic infrared-to-visible upconversion devices and their use as injectable light sources. Processing of the National Academy of Sciences of the USA, 115(26), pp. 6632–6637. doi.org/10.1073/pnas.1802064115.
- Shi, Z., et al. (2019) Ultrafast and low-power optoelectronic infrared-to-visible upconversion devices. Photonics Research, 7(10), pp. 1161–1168. doi.org/10.1364/PRJ.7.001161.
- Klapoetke, N. C., et al. (2014) Independent optical excitation of distinct neural populations. Nature Methods, 11, pp. 338–346. doi.org/10.1038/nmeth.2836.
- Shockley, W & Queisser, H J (1961) Detailed balance limit of efficiency of p-n junction solar cells. Journal of Applied Physics, 32(3), pp. 510–519. doi.org/10.1063/1.1736034.
- Varshni, Y P (1967) Temperature dependence of the energy gap in semiconductors. Physica, 34(1), pp. 149–154. doi.org/10.1016/0031-8914(67)90062-6.
- Vurgaftman, I., et al. (2001) Band parameters for III–V compound semiconductors and their alloys. Journal of Applied Physics, 89(11), pp. 5815–5875. doi.org/10.1063/1.1368156.
- Ding, H., et al. (2019) Power- and spectral-dependent photon-recycling effects in a double-junction gallium arsenide photodiode. ACS Photonics, 6(1), pp. 59–65. doi.org/10.1021/acsphotonics.8b01404.
- Corbett, R., et al. (1997) Noninvasive measurements of human brain temperature using volume-localized proton magnetic resonance spectroscopy. Journal of Cerebral Blood Flow & Metabolism, 17(4), pp. 363–369. doi.org/10.1097%2F00004647-199704000-00001.
- Sung, D., et al. (2021) Personalized predictions and non-invasive imaging of human brain temperature. Communications Physics, 4, p. 68. doi.org/10.1038/s42005-021-00571-x.
- Fiber Sensors & Probes. In: Weidmann Technologies Deutschland GMBH. Available at: https://weidmann-optocon.com/products/fiber-sensors-probes/.
- OTG-M170. In: Opsens Medical Inc. Available at: https://opsensmedical.com/products/oem-lifescience-solutions/fiber-optic-temperature-sensors/otg-m170/.
- Kyuma, K., et al. (1982) Fiber-optic instrument for temperature measurement. IEEE Transactions on Microwave Theory and Techniques, 30(4), pp. 522–525. doi.org/10.1109/TMTT.1982.1131092.
- Deuis, J. R., et al. (2017) Methods used to evaluate pain behaviors in rodents. Fronters in Molecular Neuroscience, 10, p. 284. doi.org/10.3389/fnmol.2017.00284.
- Miyamoto, K., et al. (2021) A novel mouse model of heatstroke accounting for ambient temperature and relative humidity. Journal of Intensive Care, 9, p. 35. doi.org/10.1186/s40560-021-00546-8.Vogt, N (2019) Optogenetics turns up the heat. Nature Methods, 16, p. 681. doi.org/10.1038/s41592-019-0528-2.
- Meng, C. B., et al. (2018) Spectrally resolved fiber photometry for multi-component analysis of brain circuits. Neuron, 98(4), pp. 707–717.e4. doi.org/10.1016/j.neuron.2018.04.012.