High accuracy optical surface measurements are usually achieved by utilizing interferometric methods. Under null testing conditions resolutions in the single digit nanometer range are gathered for spherical optics.
Yet, to successfully resolve the dense fringe patterns, interferometric testing of aspheric optics usually requires a type of null corrector1-3. When utilizing conventional null lenses, asymmetric aberrations are measured by rotating the surface under test to a finite number of positions and comparing them to one another.
Nevertheless, due to possible systematic rotationally symmetric errors with the null lens itself, rotationally symmetric errors are harder to know with certainty. In addition, null lenses can be expensive to fabricate and are designed for a specific asphere.
So, other test techniques such as holographic, interferometric, and non-interferometric, have been created to measure aspheres4-6. Non-null interferometer testing of aspheres is viable if the fringes can be resolved by the measurement system and the non-null influences of the imaging system are understood9-11.
Another technique which is utilized to measure aspheres is profilometry.12-15 This technique supplies simple and accurate scans of the asphere with the possibility of mapping the entire surface.
The degree of accuracy which can be attained depends on the reference datum of the measurement system and the type of probe utilized. The probe types are divided into two general areas; contact and non-contact probes. Contact probes can take highly accurate measurements but run the risk of damaging the surface.
A non-contact measurement probe is preferable for that reason. In this article, a technique for characterizing the symmetric aberrations of an aspheric surface using a non-contact probe is developed. A single scan is acquired across the center of the aspheric surface.
While the probe is held fixed above the surface being scanned the part is translated. The data processing of the surface measurements, experimental setup, discussion of the measurements results and comparison to interferometric measurements are outlined below.
System Description
The measurement system is made up of a non-contact measuring probe and either a rotary or linear air bearing on which the part is mounted, as shown in Figure 1. The non-contact probe is a fringe tracking, fizeau interferometer made up of a fiber optic cable, laser diode source, GRIN lens, control unit and PC computer.
The non-contact probe measures the relative alteration in distance between the fiber tip, probe reference surface, and the part under test. The non-contact probe remains stationary, while the test part is translated or rotated.
The working distance for the probe is 15 mm with a range of +/- 1 mm. The angular range is +/- 5 degrees and is the limiting factor for determining which setup the optic will be tested on, either the linear or rotary air bearing.
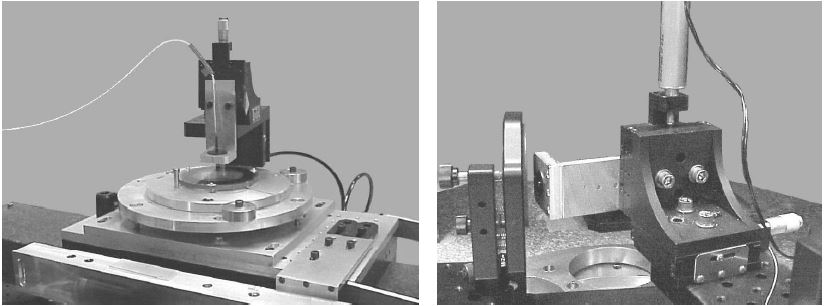
Figure 1. Experimental setup for testing nearly plano aspheres on linear air bearing is shown on the left and for spherical aspheres mounted on rotary air bearing is shown on the right. Image Credit: Corning Incorporated - Advanced Optics
The test part is put on a kinematic tip/tilt plate on top of the linear air bearing stage. The plate enables precise leveling and placement of the test part. The GRIN lens part of the probe is mounted on micrometer slides to permit the exact positioning of the probe above the center of the test piece.
Then a surface scan through the center of the part is measured as the part is translated under the probe. The linear air bearing stage runs on a granite bar and is coupled to a motorized linear ball screw slide in such a way that only horizontal linear motion is transferred to the air bearing. This is to minimize stage errors.
A Heidenhain glass scale provides position of the linear air bearing stage. The whole assembly is in a temperature-controlled environment and is mounted on an air-isolated table in order to minimize transmitted vibration.
For precise rotation and position feedback, the rotary air bearing has an integral motor and encoder. A vertical tip/tilt stage holds the test part and is mounted on a linear slide which is attached to the rotary stage. Again, the non-contact probe is mounted on micrometer slides.
As the part rotates on the air bearing, the non-contact probe is positioned to measure the surface profile through the center of the part. The probe placement relative to a concave test part is shown in Figure 2.
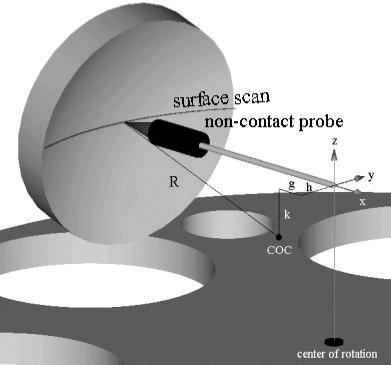
Figure 2. Typical setup on air bearing stage. Image Credit: Corning Incorporated - Advanced Optics
For aligning the test part center of curvature, COC, to the stage center of rotation, sufficient degrees of freedom are available. This reduces the distances shown by g, h and k in the figure to zero.
In order to minimize transmitted vibration, this setup is mounted on a large granite block also in a temperature-controlled environment. Both the encoder position and non-contract probe are sampled and analyzed via a standard PC computer.
Error Analysis
It was necessary to minimize systematic errors in the final measurement in order to maximize the reliability of surface profile measurement. First, an understanding of the non-contact probe measurement error sources was gathered. Numerous test configurations were assessed for background noise when measuring with the probe.
The results of measurement scans of 10 seconds duration sampled at 500 Hz are tabulated in Table 1. The first three tests were carried out with no motion; the reference flat and probe were stationary. The last two test cases show measurements using typical run parameters for motion control.
The reference flat which was utilized in the measurements was tested interferometrically and exhibited a low order surface error in the +/- 5 nm range, the same was true of the reference sphere. The results in the table are listed down the columns with increasing noise and relaxing constraints in the raw data.
Table 1. Evaluation of background noise for non-contact probe for various configurations. Source: Corning Incorporated - Advanced Optics
| Description of probe setup |
Raw Data |
Filtered Data |
| TIR (nm) |
RMS (nm) |
TIR (nm) |
RMS (nm) |
| Rigidly coupled to ref. flat |
13.6 |
2.2 |
1.5 |
0.4 |
| Above stationary ref. flat |
28.6 |
4.8 |
6.5 |
1.3 |
| Above stationary ref. flat with motor running |
40.0 |
6.7 |
6.8 |
1.5 |
| Above moving ref. flat |
49.0 |
8.3 |
6.7 |
1.6 |
| Next to rotating ref. sphere |
93.0 |
16.0 |
5.8 |
1.3 |
Yet, the user was not interested in assessing the high frequency features in the surface profile. So, a low-pass filter with a cut-off frequency of 3 Hz for the stationary test conditions and 2 mm-1 for moving test conditions was used.
The overall noise level was consistently found to be in the 6-7 nm range TIR and 1-2 nm RMS. So, the non-contact probe is able to resolve higher than 1 mm spatial features roughly 10-20 nm in height.
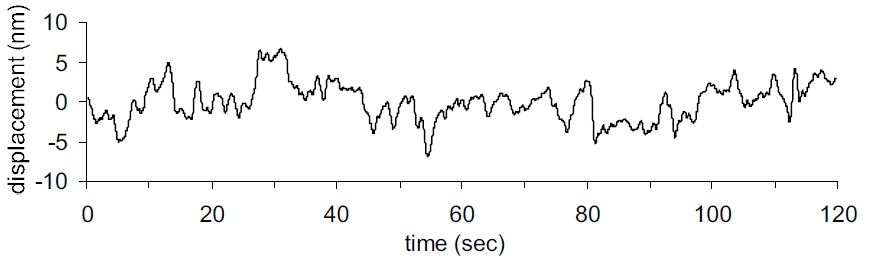
Figure 3. Noise and trending measured on linear air bearing with non-contact probe mounted over stationary reference flat with motor running. Image Credit: Corning Incorporated - Advanced Optics
By measuring the reference flat surface, systematic errors of the linear slide were assessed. The reference flat was mounted on the kinematic plate on the linear air slide. Any deviation from this could be attributed to slide error, as the reference surface profile was known to be +/- 5 nm from interferometer measurements.
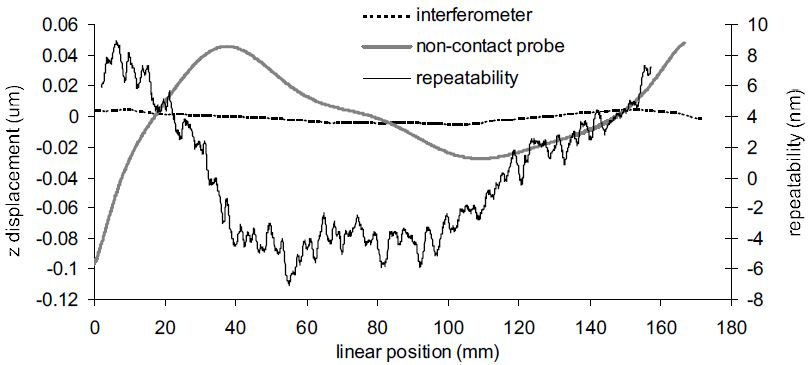
Figure 4. Linear air bearing slide error as measured with non-contact probe and reference flat. Reference flat has less than +/- 5 nm surface irregularity as shown by interferometer results. Slide error measurement to measurement variation is +/- 8 nm. Image Credit: Corning Incorporated - Advanced Optics
Figure 4 shows the slide error which was measured and found to be around 140 nm TIR over 160 mm of travel. The slide must repeat itself to remove this error from unknown surface measurements accurately. For 15 measurements, surface measurement repeatability was found to be +/- 8 nm.
The exact placement of the test part under the non-contact probe decreases positional errors which relate to not measuring through the center of the asphere. The system resolution in placement of the surface is 13 µm, which is more than enough since a 0.1 mm lateral offset results in a 1 nm error.
Systematic errors which are associated with the rotary air bearing were discovered to be under 2 nm TIR over 50 degrees of rotation. An interferometer measurement of a reference sphere and the same reference measured on the rotary air bearing with the non-contact probe are compared in Figure 5.
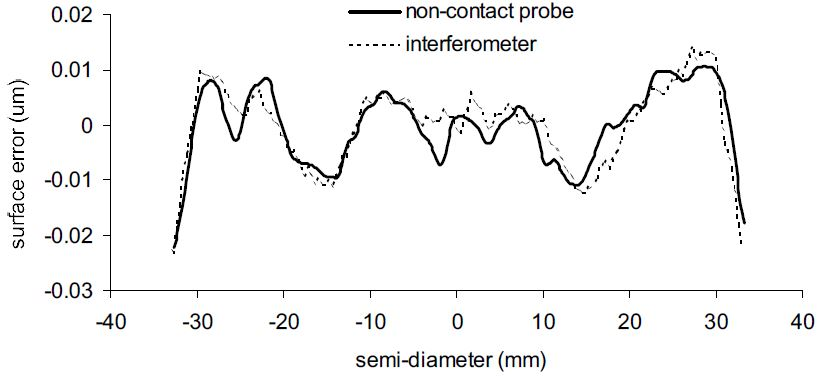
Figure 5. Measurement of reference sphere on rotary air bearing using non-contact probe as compared to interferometer measurement showing the systematic error in the air-bearing spindle. Image Credit: Corning Incorporated - Advanced Optics
The 2 nm oscillations in the probe results is because of the air bearing spindle. Repeatability was also over +/- 2 nm. Another possible source of measurement error deals with positional accuracy of the test part relative to the center of rotation of the air bearing. Results from a sensitivity analysis of the positioning errors are shown in Figure 6.
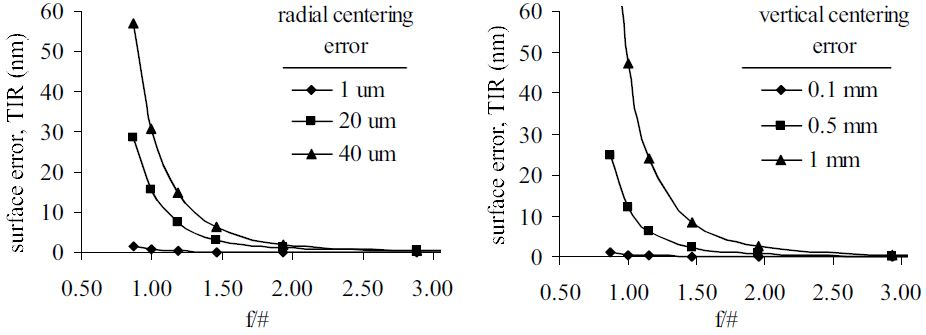
Figure 6. Surface error due to center of curvature not at air bearing center of rotation (defocus) and due to vertical offset of probe measurement location. Image Credit: Corning Incorporated - Advanced Optics
It is desired that these errors be under 1 nm. Design of the alignment controls on the measurement apparatus enables the alignment of COC with the center of rotation, positioning of the test part to a resolution of 1 µm in the radial direction, 13 µm in the vertical direction, and alignment of optic axis with center of rotation. So, it is possible to position the test part accurately to attain errors lower than 1 nm.
Data Processing Method
The following technique was developed to minimize asymmetric aberrations in the surface measurement. One scan of the surface profile, z(xi), is calculated over the center diameter of the test part. The systematic slide error is subtracted from the surface scan for the linear air bearing.
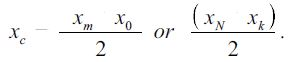
The data is mirrored in the scan direction and subtracted in order to determine the measured center of the aspheric surface. The difference is minimized in the least squares sense by shifting the data according to the equation:
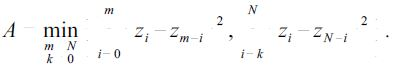 |
(1) |
By mirroring the data around the measured center, xc, utilizing the minimized values from equation (1) and the following any anti-symmetric terms present in the data are then eliminated and asymmetries are decreased by using the below equation:
 |
(2) |
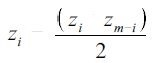
Where the measured center is given by:
 |
(3) |
The first or second equation of equation (3) is utilized based on which parameter, k or m, minimizes equation (1).
Results
The procedure above was used for the measurement of multiple aspheres. Each one of the measurements was repeated a number of times. The comparison of a 10 µm asphere on a nearly planar surface which was measured by employing the procedure suggested and in transmission on a fizeau interferometer is shown in Figure 7.
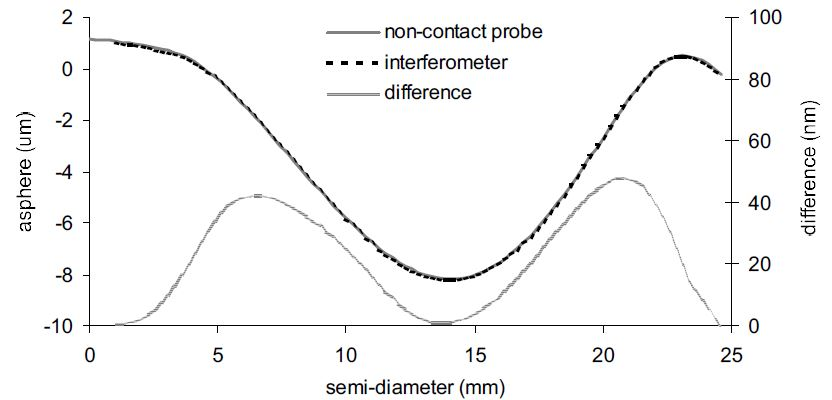
Figure 7. Comparison of non-contact probe and interferometer measurement of asphere on planar surface. Image Credit: Corning Incorporated - Advanced Optics
Due to the large number of fringes in the high slope regions, there is some slight distortion in the interferometer measurement. It is in these areas that the biggest deviation between the two measurements exists, around 45 nm.
Code V modeling of the interferometer design confirmed that the interferometer could not image these areas accurately. The non-contact probe results are compared with an interferometer measurement of a 0.3 µm asphere on a concave spherical surface with a radius of curvature of 88 mm in Figure 8.
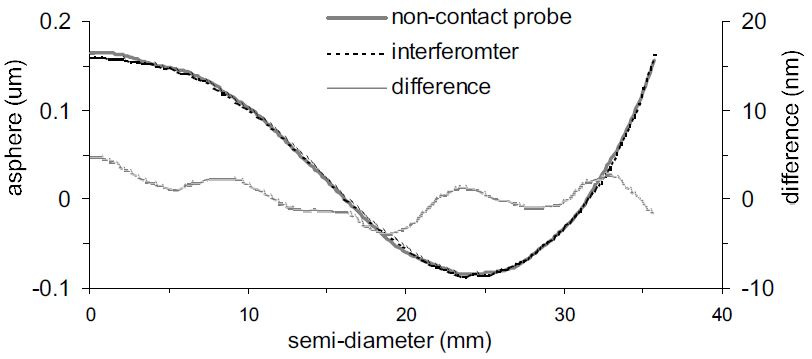
Figure 8. Comparison of non-contact probe and interferometer measurement of asphere on Cc f/1.15 surface. Image Credit: Corning Incorporated - Advanced Optics
The measurements agree to within 5 nm of one another. The low frequency sinusoidal difference is an artifact from the air-bearing spindle.
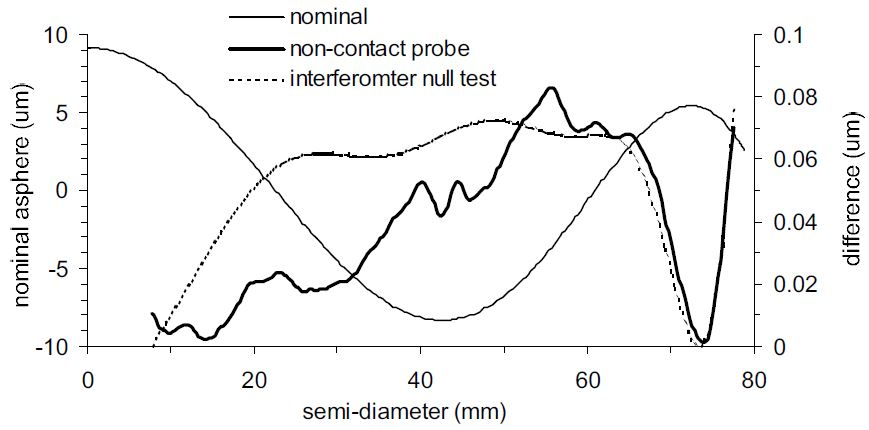
Figure 9. Comparison of non-contact probe and interferometer null test measurement of piano asphere. Image Credit: Corning Incorporated - Advanced Optics
Conclusions
Using the procedure described, multiple examples of aspheric surfaces, concave and plano, were measured and compared to interferometer measurements. In one instance, the non-contact probe results were compared to null test measurements of a planar aspheric surface.
The results confirmed that it is viable to characterize symmetric aberrations in large departure aspheric surfaces to almost single digit nanometer precision. Error sources were examined and determined to be in the single digit nanometer range.
To reduce noise further, measurement data was low-pass filtered and vibration, enabling the non-contact probe to resolve better than 1 mm spatial features roughly 10-20 nm in height.
References
- P. L. Ruben, #Refractive null correctors for aspheric surfaces,# Appl. Opt., 15, pp. 3080.3083 , 1976.
- A. Offner and D. Malacara, ïNull tests using compensators,ñ in Optical Shop Testing, 2nd ed., D. Malacara, ed. (Wiley, New York, 1992), pp. 427ò454.
- R. Pursel, #Null testing of an f/0.6 concave aspheric surface,# Proc. SPIE Vol. 2263, Current Developments in Optical Design and Optical Engineering IV, pp 210.217, 1994.
- J. G. Dil, P. F. Greve and W. Mesman, #Measurement of steep aspheric surfaces,# Appl. Opt., 17, pp. 553.557, 1978.
- H. van Brug, M. Melozzi, L. Pezzati, and A. Mazzoni, ïTesting aspheric surfaces using multiple annular interferograms,ñ Opt. Eng., 32, pp. 1073ò1079, 1993.
- B. Dorband and H. J. Tiziani, #Testing aspheric surfaces with computer.generated holograms: analysis of adjustment and shape errors,# Appl. Opt., 24, pp. 2604.2611, 1985.
- H. Lee and S. Kim, #Precision profile measurement of aspheric surfaces by improved Ronchi test,# Opt. Eng., 38(6), Donald C. O(Shea; Ed., pp. 1041.1047, 1999.
- A. Handojo and H. J. Frankena, #Testing Aspheric Surfaces: Simple Method with a Circular Stop,# Appl. Opt., 37, pp. 5969.5973, 1998
- A. E. Lowman and J. E. Grivenkamp, #Interferometer induced wavefront errors when testing in a non.null configuration,# in Interferometry VI: Applications , R. J. Pryptniewicz , G. M. Brown , and W. E. Jeuptner , eds. , Proc. SPIE 2004, pp. 173.181, 1993.
- C. Huang, #Propagation errors in precision Fizeau Interferometry,# Appl. Opt., 32, pp. 7016.7021, 1993.
- P. E. Murphy, T. G. Brown and D. T. Moore, #Interference imaging for aspheric surface testing,# Appl. Opt., 39, pp. 2122.2129, 2000.
- J. D. Lytle and A. L. Palmer, #Aspheric profile gauging using a bootstrap data interpretation technique,# Appl. Opt., 18, pp. 1064 .1070, 1979.
- 13. K. Yoshizumi, T. Murao, J. Masui, R. Imanaka, and Y. Okino, #Ultrahigh accuracy 3.D profilometer,# Appl. Opt., 26, pp. 1647.1653, 1987.
- W. Gao and S. Kiyono, #Development of an optical probe for profile measurement of mirror surfaces,# Opt. Eng., 36(12), Brian J. Thompson; Ed., pp. 3360.3366, 1997.
- Q. Wang, Z. Zhang, X. Zhang, and J. Yu, #Novel profilometer with dual digital length gauge for large aspheric measurements,# Proc. SPIE Vol. 4231, Advanced Optical Manufacturing and Testing Technology, pp. 39.46, 2000.
- A.V. Zvyagin, I.Eix, and D.D. Sampson, #High.speed, high.sensitivity, gated surface profiling with closed.loop optical coherence topography,# Appl. Opt., 41, pp. 2179.2184, 2002.
Acknowledgments
Produced from materials originally authored by Joseph Ellison+ and Steven VanKerkhove from Corning Tropel Corporation

This information has been sourced, reviewed and adapted from materials provided by Corning Incorporated - Advanced Optics.
For more information on this source, please visit Corning Incorporated - Advanced Optics.