Thanks to the value of gold and other precious metals, the accurate analysis of such materials has become progressively more important. This is, of course, particularly important for resellers and processors of these metals.
Image Credit: Thermo Fisher Scientific - Elemental Analyzers and Phase Analyzers
Gold scrap and jewelry are usually collected from consolidators, jewelers, dental and medical offices, pawnshops, and even electronic manufacturers. Either the product is processed to recover the precious metals for use as a raw material in the manufacture of other products or re-sold to the consumer.
The traditional fire assay process for examination of precious metals is challenged by Energy Dispersive X-Ray Fluorescence (EDXRF), which is rapidly becoming the preferred technique in the precious metal sector. Its benefits include the fact that it is a nondestructive method, so it is needed for applications where maintenance of the sample’s integrity is needed.
Another advantage of this process is that all material remains undamaged after examination, which allows for the complete recovery of the precious metal content.
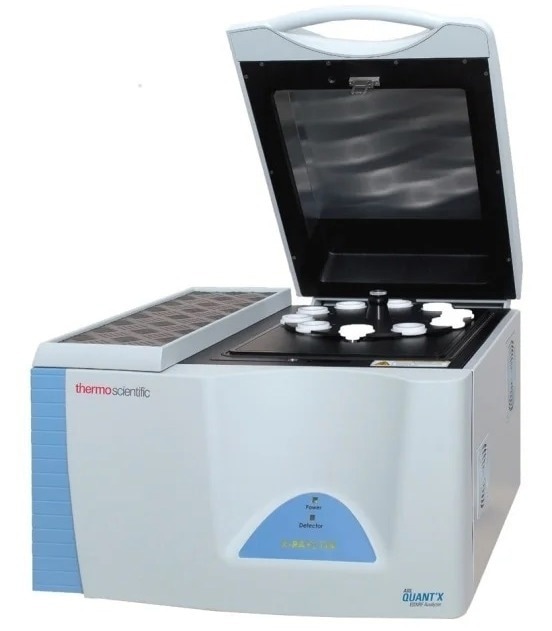
Image Credit: Thermo Fisher Scientific - Elemental Analyzers and Phase Analyzers
Testing is performed on raw materials in the form of scrap and jewelry as well as products such as solders, alloys, gold-bearing alloys, and sterling silver, both for gold content (karat) and to confirm the material’s composition. This method facilitates an initial scan of various concentrations of elements in a refining lot.
The = Thermo Scientific™ ARL™ QUANT’X Energy Dispersive X-Ray Fluorescence Spectrometer, an advanced elemental analyzer, provides the ultimate accuracy and precision required in this industry.
The instantaneous measurement of the emission lines for all elements from sodium (Na, Z = 11) to uranium (U, Z = 92) is enabled by the technology, which is based on the EDXRF principle. The detection of precious metals is a suitable task for the Silicon Drift Detector (SDD) with an area of 30 mm2.
Along with a modifiable X-Ray beam collimation and a sample-imaging CCD camera, the ARL QUANT’X Spectrometer supports the placement of small pieces of jewelry for effective analysis and excitation.
The sampling flexibility generally seen in micro-analyzers is combined with all of the analytical characteristics of selectivity and sensitivity that are integral to a bulk-analysis spectrometer. Small samples or features can be aligned to enhance the accuracy of quantitative and qualitative analysis, as the operator can picture and locate the sample before examination.
Excitation Conditions
Greater precision and sensitivity are realized by the ARL QUANT’X Spectrometer via source-tuned excitation of the sample, which is used to fluoresce only the elements of interest.
The system provides a nearly-limitless combination of excitation voltages (4–50 kV) and many primary beam filters (nine) for ideal background control, enhancing elemental sensitivity and decreasing background, resulting in improved performance.
Table 1 shows that two conditions were used to gather the spectra for gold and related alloying elements. To enhance the input count rate, the tube current is automatically adjusted. All measurements are carried out in an air atmosphere, and the total counting time for each analysis is 8 minutes.
Table 1. Analytical settings. Source: Thermo Fisher Scientific - Elemental Analyzers and Phase Analyzers
| Voltage (kV) |
Tube filter |
Atmosphere |
Live time (s) |
Elements |
| 20 |
Pd Medium |
Air |
120 |
Au, Cu |
| 50 |
Cu Thick |
Air |
120 |
Ag |
Sample Preparation and Presentation
All standards and samples were examined as received. For presentation to the spectrometer, the samples and standards were positioned in a standard XRF sample cell equipped with a 4 μm polypropylene X-Ray support film.
Calibration
In order to perform the calibrations, a Fundamental Parameter (FP) method was applied. The basic quantitative package provided with the ARL QUANT’X Spectrometer includes this technique, which yields outstanding results.
A relationship between spectrometer reaction and element concentration is determined by the FP technique based on a standard set. The software uses a variety of important parameters, including the primary principles of X-Ray absorption and emission, as the name suggests, to correct for matrix interactions.
The FP software can use any mixture of standards ranging from matrix matched to pure element standards for calibration. Table 2 illustrates the standards used in this application.
Table 2. Elemental concentrations of the calibration standards used for gold analysis. Source: Thermo Fisher Scientific - Elemental Analyzers and Phase Analyzers
| Standard |
Ni (%) |
Cu (%) |
Zn (%) |
Ag (%) |
Au (%) |
| 1 |
11.81 |
35.32 |
11.17 |
0 |
41.70 |
| 2 |
14.49 |
30.72 |
11.58 |
0 |
42.06 |
| 3 |
0 |
40.26 |
7.97 |
10.09 |
41.68 |
| 4 |
0 |
39.50 |
5.23 |
13.30 |
41.68 |
| 5 |
9.20 |
23.77 |
8.55 |
0 |
58.48 |
| 6 |
0 |
29.23 |
4.71 |
7.63 |
58.43 |
| 7 |
0 |
24.50 |
4.29 |
12.82 |
58.39 |
| 8 |
0 |
30.33 |
6.42 |
4.91 |
58.34 |
| 9 |
0 |
28.20 |
3.65 |
9.51 |
58.43 |
| 10 |
5.76 |
14.08 |
5.05 |
0 |
75.11 |
| 11 |
0 |
12.48 |
0 |
12.48 |
75.04 |
| 12 |
0 |
9.86 |
0 |
15.08 |
75.06 |
| 13 |
0 |
10.66 |
0 |
1.73 |
87.61 |
| 14 |
0 |
4.91 |
0.16 |
3.25 |
91.38 |
Calibration Results
The regression curves for the key components of gold jewelry and alloys, Ag, Cu, and Au, are displayed in Figures 1 through 3. Using the Fundamental Parameter calibration technique, a good correlation is shown by the plots between the specified elemental concentrations and the calculated concentrations.
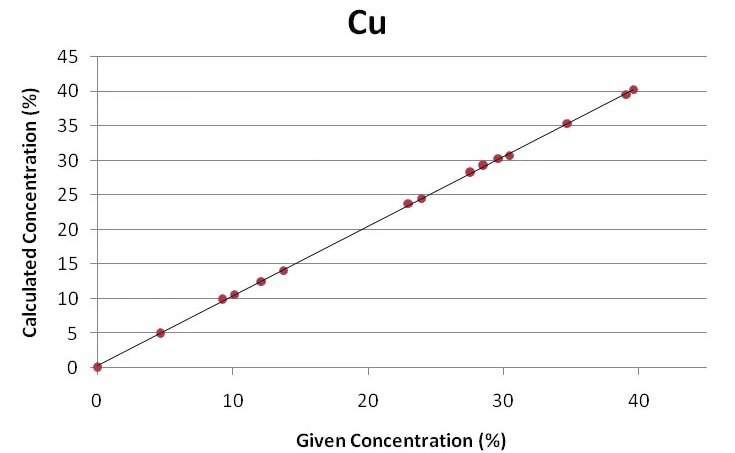
Figure 1. Regression curve for copper. Image Credit: Thermo Fisher Scientific - Elemental Analyzers and Phase Analyzers
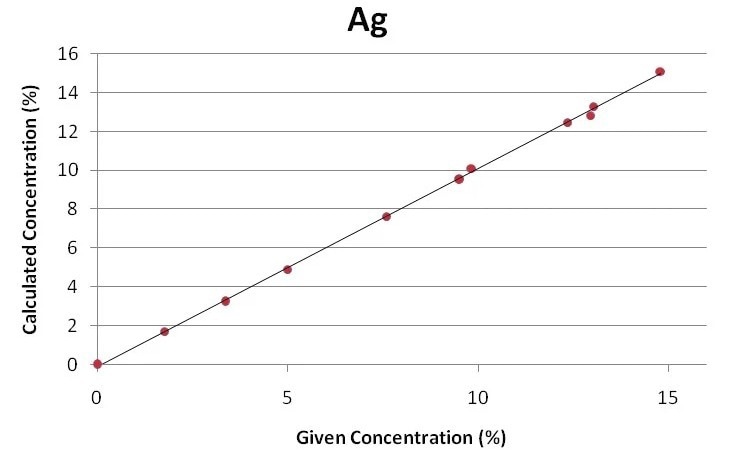
Figure 2. Regression curve for silver. Image Credit: Thermo Fisher Scientific - Elemental Analyzers and Phase Analyzers
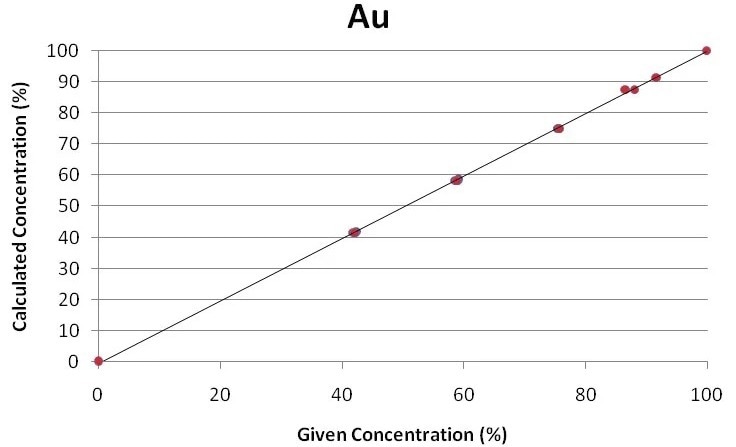
Figure 3. Regression curve for gold. Image Credit: Thermo Fisher Scientific - Elemental Analyzers and Phase Analyzers
Repeatability
Verification that the instrument’s sensitivity and repeatability match the application requirements is the main goal of a sample evaluation.
To measure the reproducibility of the technique, replicate measurements of a jewelry sample were performed. The mean concentration and 1-sigma Standard Deviation of these measurements are shown in Table 3, along with the certified value of the sample. Measurement times identical to the calibration were applied.
Table 3. Repeatability results of gold jewelry sample. Source: Thermo Fisher Scientific - Elemental Analyzers and Phase Analyzers
| Run |
Au (%) |
Ag (%) |
Cu (%) |
| 1 |
51.74 |
10.55 |
31.69 |
| 2 |
51.81 |
10.54 |
31.65 |
| 3 |
51.77 |
10.51 |
31.69 |
| 4 |
51.76 |
10.51 |
31.65 |
| 5 |
51.66 |
10.54 |
31.66 |
| 6 |
51.68 |
10.53 |
31.74 |
| 7 |
51.72 |
10.55 |
31.66 |
| 8 |
51.73 |
10.59 |
31.60 |
| 9 |
51.72 |
10.57 |
31.60 |
| 10 |
51.73 |
10.59 |
31.63 |
| Average |
51.73 |
10.55 |
31.66 |
| Std. Dev. |
0.04 |
0.03 |
0.04 |
| Certified Value |
51.67 |
10.54 |
31.40 |
Conclusion
The unparalleled performance of the ARL QUANT’X EDXRF Spectrometer in the measurement of precious metals in gold jewelry is shown by these results, with the use of an efficient SDD, primary beam filters for background control, flexible fundamental parameter software, and a high-powered X-Ray tube.
The precision and accuracy required in the precious metals sector are offered by the ARL QUANT’X Spectrometer.

This information has been sourced, reviewed and adapted from materials provided by Thermo Fisher Scientific - Elemental Analyzers and Phase Analyzers.
For more information on this source, please visit Thermo Fisher Scientific - Elemental Analyzers and Phase Analyzers.