The use of cellular and biomolecular processes is expanding throughout medical, energy, and environmental applications. This means that there is a need created for real-time sensing of both reactants and products via process analytical technology (PAT).
Already, Raman is an accepted and established process monitoring tool used in PAT, giving supreme analytical selectivity while being notably insensitive to water present as solvent or moisture within the sample.
This article investigates the use of Raman to monitor a simple bioprocess, fermentation of glucose (a standard feedstock) with yeast, a microorganism typically used in biotechnology. Utilizing a probe-based WP 785 Raman system, glucose concentration in a yeast solution was the focus of calibration.
Subsequently, the glucose content was monitored throughout fermentation. The application of multivariable tools to the Raman spectra also enabled continual analysis of the progress of the overall reaction and the ability to identify the main reactants: glucose, carbon dioxide, and ethanol. The results illustrate how a sensitive, stable Raman system can be applied in PAT for effective bioprocessing applications, even when fluorescence background is present.
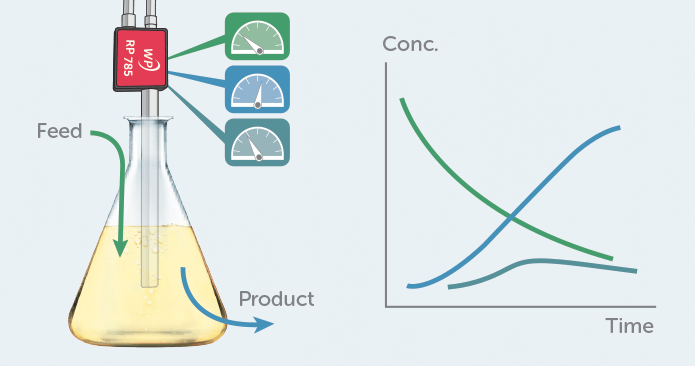
Figure 1. Raman can be used in a bioprocess to monitor several compounds in parallel, providing direct chemical information in real-time.
Raman, a PAT Solution for Biotechnology
Microbial biotechnology channels the fermentation process of microorganisms to produce value-added products such as processed food products, biogas/bioethanol for energy, recombinant vaccines/antibiotics, and essential chemicals such as organic acids, enzymes, polymers, and alcohols.
Moreover, it can be put to environmental use in the treatment of wastewater for the removal of toxic materials. Microorganisms can be cultured rapidly in great quantities, and their enzyme production improved through genetic manipulations to further enhance and target these biocatalysts.
Process analytical technology, and more precisely Raman spectroscopy, can be utilized in relation to fermentation to offer real-time process monitoring. Raman’s capacity to simultaneously identify many different chemicals as well as insensitivity to water and the ability to deploy using a basic probe-based system makes it a tool well adapted to observe and control biotechnology processes with increased yield and consistency.
To exhibit these attributes, Raman spectroscopy was applied to a typical biotechnology process: the fermentation of glucose with yeast. This was conducted using a 785 nm Raman spectrometer attached to a dip probe introduced to the fermentation mixture. The resulting set of Raman spectra were analyzed both quantitatively, by removing the glucose concentration and observing the overall reaction progress, as well as qualitatively by identifying the main reactants of the process through their Raman spectra.
Probe-based Raman Process Monitoring
The Raman process monitoring system was based on a WP 785 spectrometer covering 270-2000 cm-1 with a 10 cm-1 resolution, fitted with a TEC-regulated detector (Figure 2). An external 785 nm laser produced 350 mW of excitation light, fiber-coupled into the RP 785-VAR probe equipped with a unique process barrel. This novel probe design includes a tip that is interchangeable to enable probe reconfiguration for varying sample types and working distances.
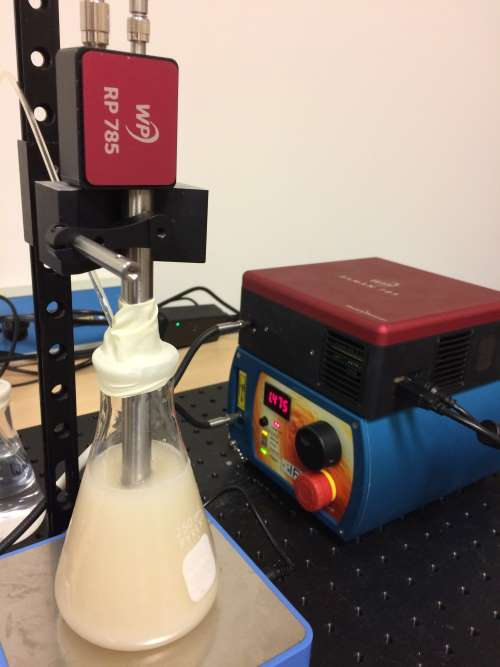
Figure 2. Fermentation Setup (front) on a magnetic stirrer (bottom) with probe (top) and spectrometer and laser (back). Image Credit: Wasatch Photonics, Inc.
In this instance, it was calibrated as a 15 cm long immersion probe. The Raman emission gathered by the probe was passed to the spectrometer with a 0.39 NA fiber to fill the f/1.3 input aperture of the spectrometer fully for the highest sensitivity.
For both calibration and monitoring, the Raman spectra were collected with an integration time of 5 seconds. Calibration spectra were registered 20 times for each solution. Throughout fermentation, the collection and averaging of 20 spectra were conducted and then repeated at 120-second intervals. All spectra were saved with a “laser-on dark” blank subtracted. This blank measurement was conducted using the same sample container filled with water.
To establish the glucose concentration model, a total of 30 calibration solutions were used, which were prepared from stock glucose and yeast solutions to render all possible permutations of glucose concentration (0-50 g/L) and yeast (0-10 g/L), as illustrated in Table 1. The glucose solutions were permitted to equilibrate via mutarotation before the calibration measurements.
Table 1. Glucose and Yeast Concentrations for Calibration Solutions.
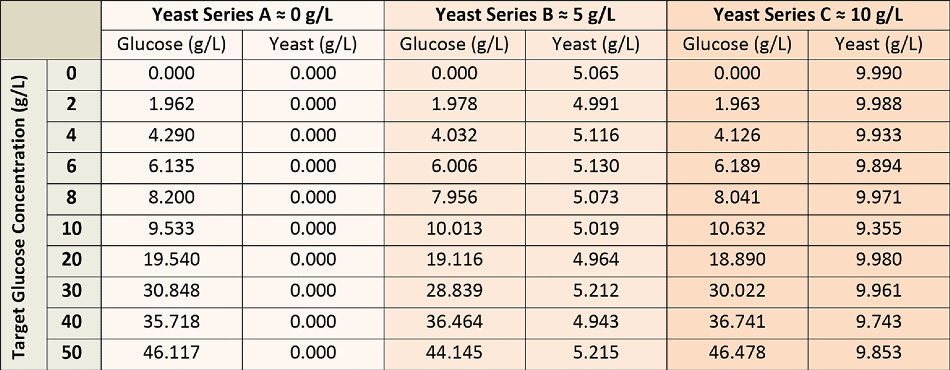
It was crucial to incorporate larger concentrations of yeast in the calibration solutions, as yeast produces and adds to fluorescence background to the Raman spectra. Each calibration solution was measured with the dip probe penetrating about 5 mm into the solution inside a large round sample vial.
The vial was positioned over a black, empty void to prevent any back reflection from the mount, aside from the vial bottom. In the case of calibration solutions with yeast, the calibration solutions were stirred to limit signal fluctuations typically made by the yeast.
The fermentation experiment was carried out in a 250 mL Erlenmeyer flask. The solution was continuously stirred with a magnetic stirrer, with the dip probe piercing well past the (small) vortex surface into the solution. The flask was sealed with a rubber membrane across the top; the dip probe and a piece of tubing pierced the membrane. The opposite end of the tubing was immersed into a second water-filled flask, granting the pressure equilibration while sustaining anaerobic conditions for the fermentation.
Warm water was used in the preparation of the fermentation solution, which helps speed up the reaction, with preliminary concentrations of around 50-60 g/L glucose and 2-3 g/L yeast. The fermentation was monitored at intervals of 120 seconds over a 14-hour period.
Glucose Calibration – Knowing our Sugars
The unrefined Raman spectra for all glucose and yeast concentrations are shown in Figure 3a. Here, one can observe three groups of spectra, relating to the three yeast series: 0, 5, and 10 g/L. The fluorescence background increases in line with the yeast concentration due to its complex organic structure.
Within each yeast series, it is possible to see spectral variation corresponding to the concentration of glucose; the higher concentrations demonstrate larger peaks symptomatic of the glucose structure, specifically around 500 and 1100 cm-1.
To establish a predictive model for glucose, the correlation of the middle portion of the Raman spectra was carried out. This is indicated by the two vertical dashed lines in Figure 3a, with the glucose concentration using PLS (partial least squares) regression. Thereby, the repeat spectra recorded for each calibration solution was randomly split into training and test sets of equal size. The training set was utilized to improve the calibration method through 5-fold cross-validation, and the test set was reserved to identify the final prediction error.
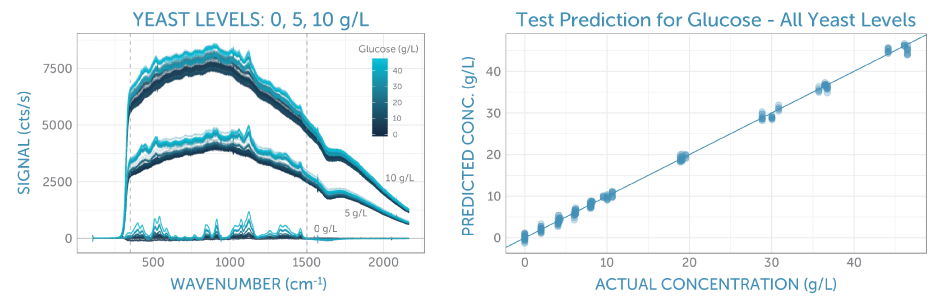
Figure 3. (a) Calibration spectra with varying glucose concentrations (as indicated by the color) at three levels of yeast (leading to different fluorescence backgrounds). The spectral region used for analysis is indicated by the two vertical dashed lines. (b) The final calibration applied to the test set. The resulting prediction error (as RMSEP) is 0.7 g/L, independent of the presence of yeast in the sample.
Three approaches of pre-processing were tested: raw (no pre-processing), baseline subtraction utilizing ALS (asymmetric least squares with lambda = 4 and p = 0.001), and first derivative smoothing employing a Savitzky-Golay filter (in second-order over a 9-pixel window).
Whereas the latter two methods were efficient when it came to eliminating the yeast fluorescence background, what was surprising was that analyzing the unprocessed spectra produced the lowest cross-validation error for glucose prediction.
This was followed closely by regression of the spectra subsequent to baseline subtraction. Implementation of the last calibration regression, as illustrated in Figure 3b, generated a prediction error (RMSEP) of about 0.7 g/L, independent of the yeast concentration. With this, Wasatch Photonics could be sure of the prediction model, irrespective of yeast concentration, and ensuing fluorescence background.
Real-time Raman Process Monitoring
We monitored the Raman spectra of the fermentation sample constantly for 14 hours, taking spectra every 120 seconds. The series of unprocessed spectra plotted in Figure 4a exhibits a change of spectral features over time as the yeast consumed the glucose and in turn, generated ethanol. The relative changes and the overall signal quality are more clearly visible after the elimination of the yeast fluorescence background using ALS (asymmetric least squares), as demonstrated in Figure 4b.
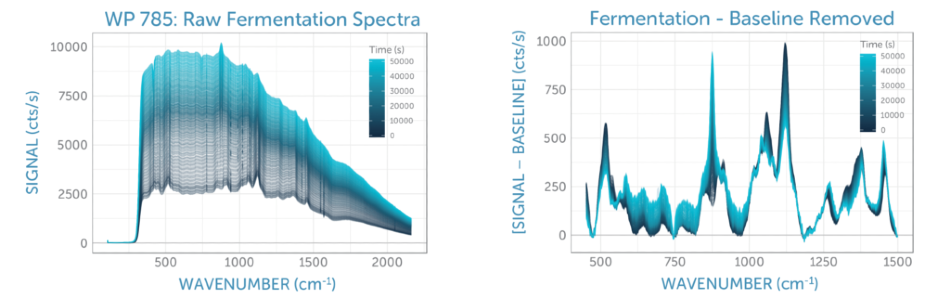
Figure 4. (a) Raman spectra recorded during glucose fermentation over 14 hours, with time indicated by the color. (b) Baseline-corrected Raman spectra recorded during glucose fermentation over 14 hours, with time indicated by the color. In both cases, the glucose peaks at around 1100 cm-1 decrease over time, while the ethanol peak at about 900 cm-1 and the overall yeast background grow, consistent with expectations for the fermentation process.
It was possible to predict the glucose concentration in real-time during the fermentation, as shown in Figure 5, by applying the PLS glucose calibration model to the unprocessed fermentation spectra as they were captured. No offline reference measurement was available for validation of the accuracy, but the prediction demonstrates a low noise level for the concentration measurement.
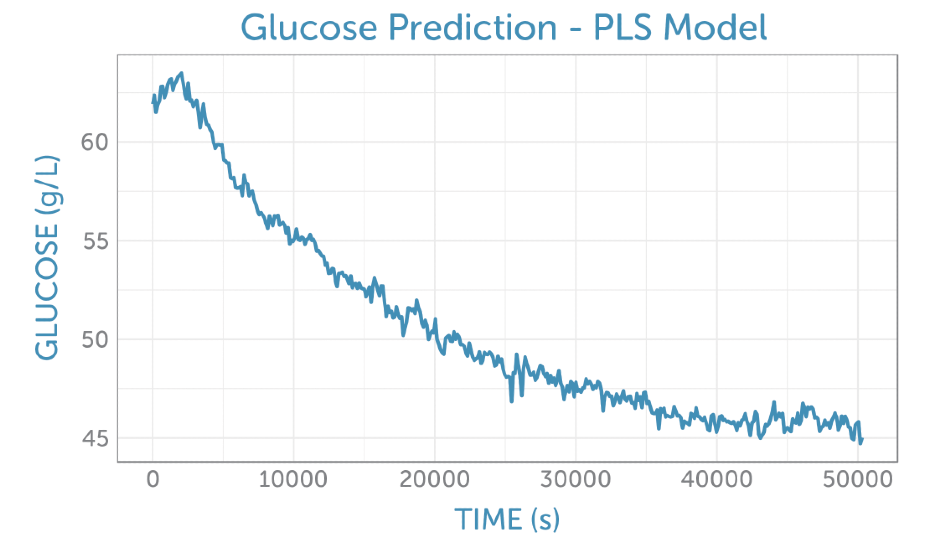
Figure 5. Prediction of the glucose concentration from the unprocessed fermentation spectra (as shown in figure 4a using the PLS calibration model.
PCA – A More Holistic View
Keen to examine what other process monitoring information could be taken from the spectra over time, principal component analysis (PCA) was conducted on the whole spectral data set obtained during the fermentation. As Wasatch Photonics was interested in a chemical interpretation of the process, they chose not to center the PCA. This choice was made so that the resulting scores and loadings would be more suggestive of concentrations and component spectra rather than extracting the more difficult to interpret relative spectral changes. In addition, to ignore the dominant yeast contribution to the signal, PCA was performed on the baseline-corrected spectra shown in Figure 4b.
The determination of four principal components revealed that each was rich in information about the reactants and products. The PCA scores as a function of time can be seen in Figure 6.
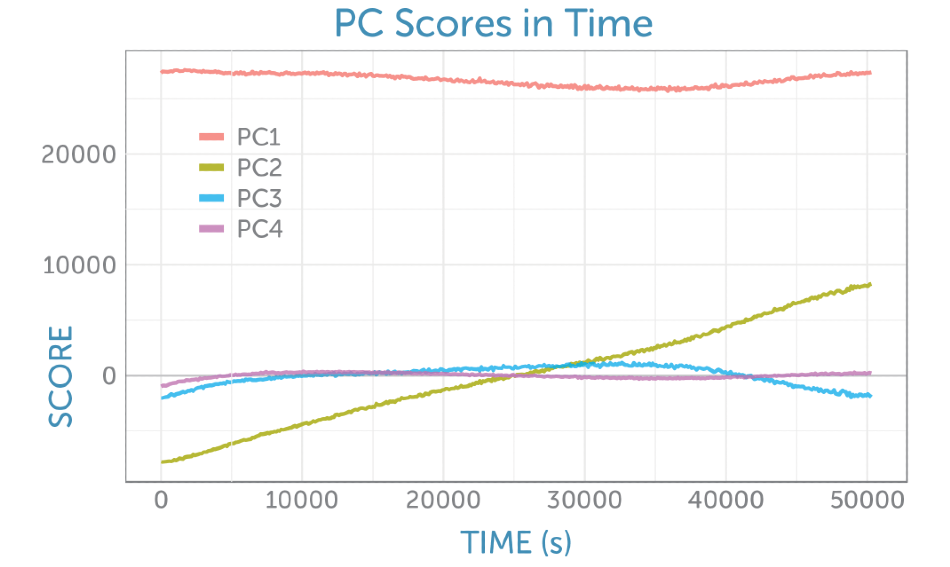
Figure 6. Scores as a function of time from the non-centered PCA of the baseline-corrected Raman spectra recorded during the fermentation.
For best interpretation of the scores, corresponding loadings plotted as Raman spectra on the corresponding frequency axis can be looked at. Contrary to actual Raman spectra, loadings can hold both positive and negative contributions and frequently have the appearance of different spectra. These are simpler to interpret in contrast to the reference spectra taken for glucose (the feedstock, which is consumed during fermentation) and ethanol (the product generated), as illustrated in Figure 7.
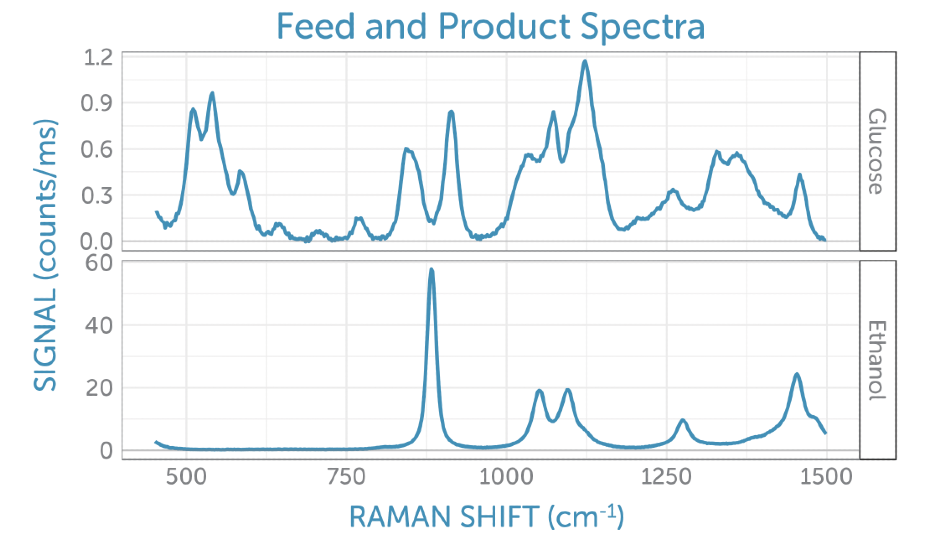
Figure 7. Reference Raman spectra for the feedstock, glucose (top) and product, ethanol (bottom).
The loadings for the four primary components are exhibited in Figure 8. The loading for the initial PCA component matches the glucose Raman spectrum, while the second component gives the appearance of the difference spectrum between the reactant glucose and the key product ethanol as shown by PC2 in Figure 6. The scores of the second component consistently increase throughout the fermentation, giving a visual indicator of the overall progress of the reaction through the ratio of these two components, which is perfect for process monitoring.
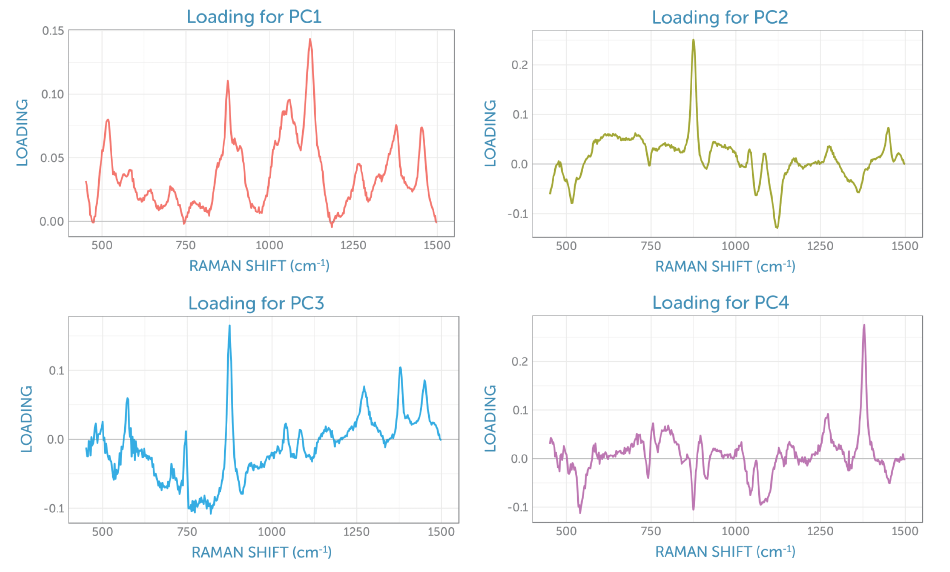
Figure 8. Component loadings from the non-centered PCA of the baseline-corrected Raman spectra recorded during the fermentation.
The third loading holds spectral signatures from four different contributions: the product ethanol, the reactant glucose, the dissolved by-product carbon dioxide with its peaks at 1280 and 1382 cm-1, and two remaining peaks from sapphire (the dip probe optical material), with peaks at around 580 and 750 cm-1. It appears that the fourth loading is dominated by carbon dioxide, which due to the stirring remains fairly consistent in solution during fermentation.
Raman Process Monitoring Success
Using a modular 785 nm Raman system equipped with an immersion probe, continuous recording of the spectra over a 14-hour fermentation of glucose with yeast was conducted. Utilizing a PLS regression model for the glucose concentration in the presence of yeast quantitative monitoring of the decrease in glucose during fermentation with high signal to noise was performed.
Further principal component analysis and plotting of the time-dependent scores revealed the second component captured the reaction progress of the conversion of glucose into ethanol. Additional reaction products, including dissolved carbon dioxide, could be determined in the greater components’ loadings.
As evident in the results of this fermentation experiment, despite the presence of considerable fluorescence background, Raman spectra can offer comprehensive information about the progress of biotechnological processes. Other processes that are well-suited to the benefits of Raman spectroscopy could also be observed using a similar approach, from solvent removal to crystallizations, including the determination of polymorphs. With a sensitive, portable system like the WP 785, Raman process monitoring of fermentation is only the start.

This information has been sourced, reviewed and adapted from materials provided by Wasatch Photonics, Inc.
For more information on this source, please visit Wasatch Photonics, Inc.