Modern NVH studies rely heavily upon the simulation process to decrease costs and enhance time to market. Less prototypes are being made, which means that there is a need for extensively more detailed testing than in the past. This needs better data reliability, test productivity, accuracy, and density.
The test method is Experimental modal analysis (EMA), recommended for the updating and verification of Finite Element models. EMA, despite being well established, was known in the past to be a labor-intensive process, necessitating the attachment of cables and accelerometers to the object under test.
The meshes for FE calculations commonly comprise several thousands of nodes. Simultaneous measurement locations are limited to around 10 to 100 due to the limited availability of accelerometer channels and the high cost of such a large number of sensors.
For an accurate revision to the FE model, a specific number of modes must be identified from the experimental data. Also, a reasonably high Modal Assurance Criterion (MAC) values between measured and simulated modes should be achieved. In the majority of cases, to reach these goals, more measurement locations are needed than the available number of channels or accelerometers.
Therefore, for larger objects, the accelerometers are transferred to multiple sets of locations and the test is repeated each time. To maintain the overall dynamic conditions, dummy masses can be used to replace accelerometers each time they are moved for a new test.
When validating the FE model, the total of all masses must be considered. For some structures, it is not possible to fully model the impact of the added masses in the simulation.
One of the most difficult tasks for the Noise, Vibration and Harshness (NVH) test laboratory is collecting the frequency response functions (FRF) required in the correct coordinate system, at the best locations, and in the correct orientation.
Along with the added cost and time constraints, the whole process of traditional measuring with accelerometers is vulnerable to human errors. The impact on the test results will be explained in paragraph 5.
This article outlines a testing system that is fully integrated to deliver feedback for refining and updating CAE models. This revised method is based on non-contact scanning laser Doppler vibrometry used in combination with robotics.
System creation was inspired by the concept of fully automating the EMA process in order to significantly increase the data quality together with enhanced throughput of the laboratory.
3. Scanning Laser Doppler Vibrometry
Scanning laser Doppler vibrometry (SLDV) is a popular method for non-contact experimental modal analysis. Originally conceived and developed in the 1980s [1], scanning laser Doppler vibrometers are systems used for the non-contact measurement of vibration employing the optical Doppler effect, which results in a shift in the frequency of light backscattered from a moving surface.
The frequency shift is provided by the formula:
Where λ is the wavelength of the laser, commonly a visible HeNe laser operating at 632.8 nanometers, and v is the velocity of the surface.
Frequency decoding electronics generate an instantaneous output signal proportional to the real-time velocity of the surface in the laser direction. Galvanometer-driven mirrors move the laser across the test surface as a means to acquire vibration data at every predetermined location.
As the vibrometer output is directional and can be stored, processed, and acquired in the exact same way as signals from an accelerometer, it is possible to use FFT signal processing in combination with multi-channel data acquisition, to gather all of the necessary information for a modal analysis.
Further channels are employed to gather data at the same time from alternative sources such as microphones, load cells, and accelerometers.
A complete experimental modal analysis for model updating needs the vibration amplitude and phase spectra in all three orthogonal axes of the coordinate system of the test object.
It also requires an understanding of the geometric shape of the object under test and the precise coordinate locations of all measurements. This data is found by using a three-dimensional SLDV which will be outlined in paragraph 6.1.
4. CAE Data Chain
The generation of FE models from the first design of a component is the NVH organization’s starting point. Dependant upon the complexity of material and shape parameters, a mesh is produced which ideally signifies the later prototype.
The FE model should enable the prediction of the durability and dynamic parameters of these components for a determined set of operating conditions. In the example outlined, the eigenmodes, eigenfrequencies, and modal analysis require validation in the form of an experimental modal analysis on the physical prototype.
The resulting frequency response function data, deflection shapes, and after modal extraction, the damping values and experimental mode shapes are utilized to revise the FE model.
FE models include several thousands of nodes at a minimum. In practice, a measurement for verifying the FE model includes only a subset of the FE nodes. In other words, the measurement is not complete.
This incompleteness is explained by the term incompleteness ratio:
 |
(Equation 2) |
Where n is the number of measured nodes, and N is the number of nodes in the FE model.
Other authors have demonstrated that the quality of an FE model update highly depends on the incompleteness ratio.
For example, Grafe explains, “It is a characteristic feature of large applications that the FE models are usually large and, more importantly, the number of available measurements is comparatively small [...] The real challenge of updating large FE models is not so much the size of the models, as these can be solved by ever more powerful computers, but rather small incompleteness ratios” [2].
Put simply, the amount of measurement nodes must be high enough to facilitate an accurate update of the FE model.
5. Discussion of the Conventional Approach for Modal Testing
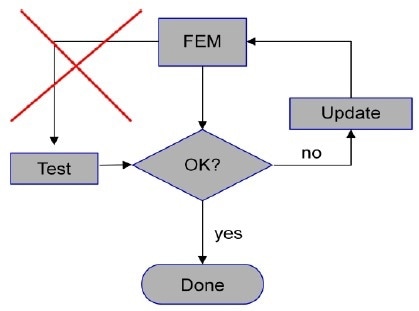
Figure 1. Test and model update lacking data link to FE.
As a means of validating the results for a modal test sourced from an FE simulation, accelerometers are attached to the surface of the device. Using the measured input force, frequency response functions (FRFs) are measured at a predetermined number of measurement points.
Although the CAE process is successful with closed data links between FEM and CAD, these links are lost when the physical test phase is entered in the traditional way. The key reason for this is the manual instrumentation of the test sample.
Consequently, the method to close this gap must contain an automated system for the collection of data which works with test descriptions established from the CAE data.
This traditional approach introduces some error sources into the test process. This lack of quality will decrease the accuracy of the subsequent FE model update and can require further iterations. The sources of error are:
- The number of sensors available is limited, which in turn limits the highest mode for the later MAC analysis and model updates.
- Correlation between the FE object coordinate system and sensor position is practically lost. For example, the position and the orientation of the triaxial sensors with their inherent x, y, z coordinate systems in particular, have to be manually determined to be precisely the same as the object coordinate system.
- Depending on the mass of the DUT, the sensor mass, including cables and fixtures, changes the resonance frequencies of the structure. This influence can be compensated in the FE model by adding the respective mass at the nodal points chosen for the sensors. If the DUT cannot be measured in one set because the number of available acquisition channels is insufficient, dummy masses can be employed to compensate for sensor mass when the sensor is not mounted.
The sources of error become greater in more lightweight structures with complex shapes.
6. New Modal Testing Approach Integrated in the CAE Process
As stated previously, a laser Doppler vibrometer analyzes the vibration component in the laser beam’s direction. With three laser vibrometers, one is able to distinguish the three-dimensional motion of a surface by directing three laser beams from three varied, known directions onto the point of measurement.
Utilizing a coordinate transformation matrix, the measured data is converted into a right-angled coordinate system. For this to be successful, the alignment of the lasers at right angles to each other is not required.
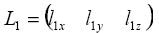
The following equation signifies the unit vector which expresses the laser beam direction of the first scan head:
 |
(Equation 3) |
The matrix below contains the directional information of all three laser beams. It is utilized to transform the three measured vibrometer signals (v1, v2, v3) into the orthogonal object coordinate system (vx, vy, vz):
 |
(Equation 4) |
All three lasers need to strike the same location for each scan point if the lasers are to be scanned over the surface. In order to perform this, the system needs to be taught the relative position of the three scan heads in the coordinate system of the DUT.
This technique, called 3-D alignment (initially described in [3]), is carried out through the use of software by orienting the three laser beams so that they combine onto a single point.
If the coordinate of this point is understood, the deflection angles of the scan mirrors are noted and the procedure is repeated at three further points. The orientation of the sensor heads in the coordinate system can then be calculated [4].
By entering the specific geometry of all points to be measured during the scan onto the system (rather than the points used for the 3-D alignment only), the lasers will, via software, consistently merge to a single location for every scan point.
The 3D-SLDV engineered by Polytec employs a time-of-flight laser distance sensor, operating through the scan mirrors, coaxial with the laser vibrometer, to experimentally establish the structure’s geometry (Geometry Scanner). Enhanced positioning accuracy can be gained through ‘VideoTriangulation’ of the three laser beams on the sample.
This is carried out using image processing to identify precisiely where the three laser beams impact the surface. This positional information is used to merge the points onto the desired surface location, a process which is repeated for every measurement point. A file containing the measured geometry can be exported into the simulation program together with the 3-D vibration data.
Alternatively, geometry files in Universal File Format (UFF) can be imported into the system. This geometry information can be presented as a 3-D plot and the vibration data can be superimposed over it.
This feature to measure geometry in addition to vibration can be highly practical, for example when benchmarking a product from a competitor. If the FE model’s geometry does not precisely match the geometry of the physical prototype, the three laser points do not merge at the surface.
In this example, VideoTriangulation can be utilized to merge the points and therefore establish the true geometry. The updated geometry model can then be transferred back into the CAE system to correct the FE model.
If no numerical model is available, for example when used in benchmarking tests, the 3D-SLDV can calculate the geometry utilizing the integrated time-of-flight laser distance sensor.
The data can be displayed as a color-coded 3-D animation of the Operating Deflection Shape (ODS) at any given frequency of interest. 3-D vibration components can either be visualized at the same time or separately into any combination of vx, vy and vz.
The software along with an 8-channel data acquisition system is able to perform Multiple Input Multiple Output (MIMO) modal testing.
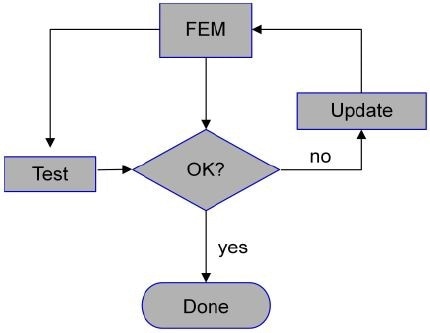
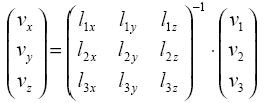
Figure 2. Closed data link to test.
Combining 3-D Scanning Laser Vibrometry with Robotics
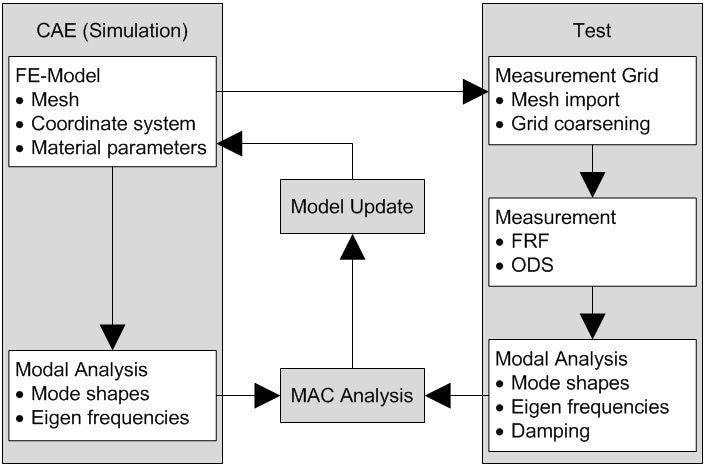
Figure 3. CAE data flow in a RoboVib Test.
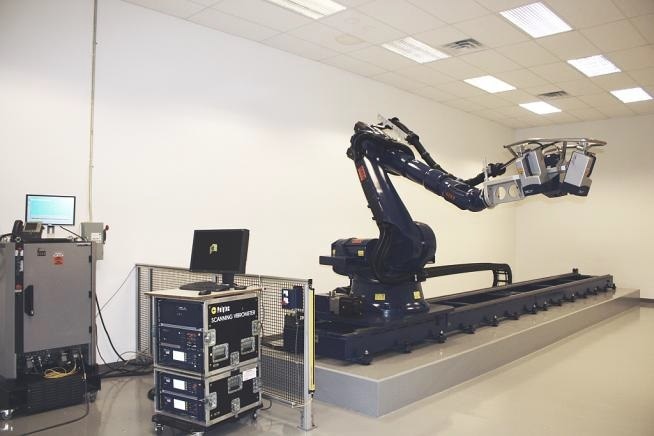
Figure 4. RoboVib Test Cell.
In order to analyze the entire surface of a complicated three-dimensional object, for example the car body shown in Figure 5, the three scan heads must be transported to several locations and the relative position of the scan heads to the object must be re-taught for each location.
Using reference points with known coordinates on the test surface, the data from each scan head array position can be stitched together into a single file.
An automatic approach that avoids 20 3-D alignment instructions saves a significant amount of effort and time because it could take as much as 20 different positions of the scan head array to analyze the total surface of an automobile body.
An industrial robot is engineered to have all of the flexibility of a human hand and arm, and contains the stability and load capacity required to correctly position three SLDV scan heads along with the cabling and fixtures.
Moreover, it is managed with a computer to ensure that the relative x, y, and z position of the held object can be constantly monitored and controlled.
In this example, the robot used has three rotation axes in its arm and a further three rotational axes in the hand. A seventh linear axis is utilized to widen the reach of the robot arm. Entire aircraft fuselages could be analyzed using this approach.
The scan heads are fixed relative to the robot flange. The 3-D alignment method outlined above only needs to be carried out once during installation to acquire the scan head positions and orientations in relation to the robot flange.
The robot control software can automatically calculate the orientations and positions of the scan heads from the robot’s coordinates in relation to the test object at any time. Throughout installation, the 3-D alignment is executed on coordinates in the coordinate system known as TOOL.
Defined in relation to the robot’s flange, the TOOL coordinate system moves in harmony with the robot. The TOOL orientation and position can be taken from the robot controller. An additional robot coordinate system known as the BASE system is calibrated to work in conjunction with the test object’s coordinate system.
This calibration employs all three lasers which are made to intersect at each of multiple calibration points on the test object with known coordinates by moving the robot. The BASE coordinate system is computed from the robot positions and the matching object coordinates.
With the TOOL coordinate system performing 3-D alignment and the calibration of the BASE coordinate system on the test object, the scan head positions in the test object’s coordinate system can be instantly calculated for any robot position. The information about geometry can either be imported or analyzed using the integrated geometry laser.
Prior to measurement, the robot positions and their sequence are clarified by teaching. According to those taught positions, the control software chooses which point to measure, and from which position.
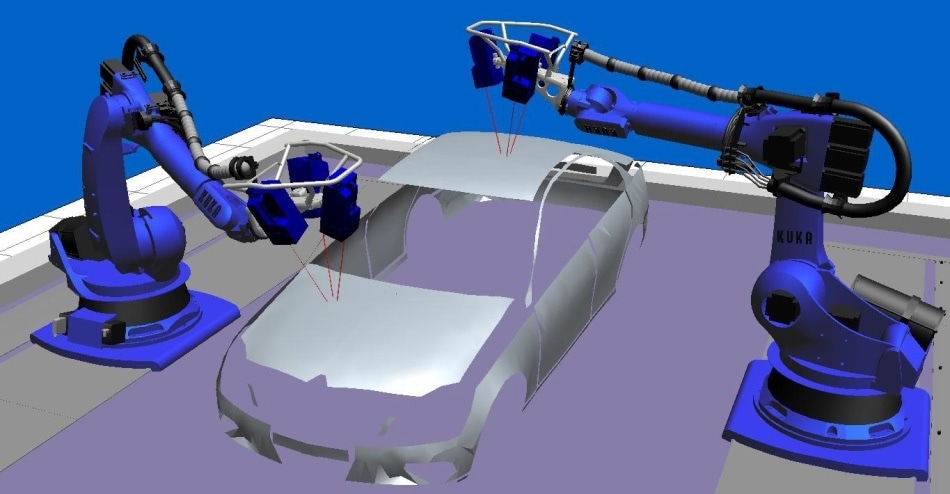
Figure 5. Simulation of twin-RoboVib test cell, with each robot on a linear track.
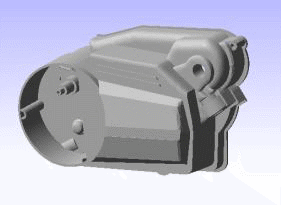
7. Case Study: Modal Updating on a Gearbox Cover
In order to compare the updated automatic approach with traditional manual accelerometer measurement, two sets of measurements are carried out along with a modal analysis of the data. A cast alloy side-cover of a motorcycle gearbox was used as a sample.
| Model Attribute |
Description |
| Mesh Type |
Tetrahedral |
| Elements |
69019 |
| Nodes |
19994 |
| Material |
Aluminum cast alloy |
Figure 6. Gearbox cover for the case study and the parameters of the FE model.
A modal analysis carried out on the FE model to compare the results of the two testing methods in the subsequent MAC analysis.
7.1.1 Conventional Test with Accelerometers
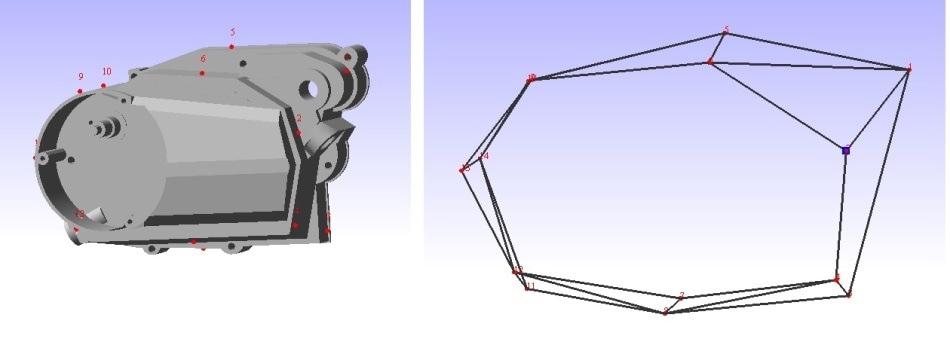
Figure 7. Cover with marked locations for probing and corresponding mesh.
- Boundary condition: Free-free
- Excitation: Modal hammer with force cell
- Measurement locations: 14 measurements points / 42 DOF
The gearbox cover was probed with traditional triax accelerometers under conditions that were free-free. Figure 8 presents the related FE-updating method. The measurement locations are selected manually, and the instrumentation is similarly a manual process. The results (shown in Figure 13) demonstrate the first and second mode, both below 1 kHz.
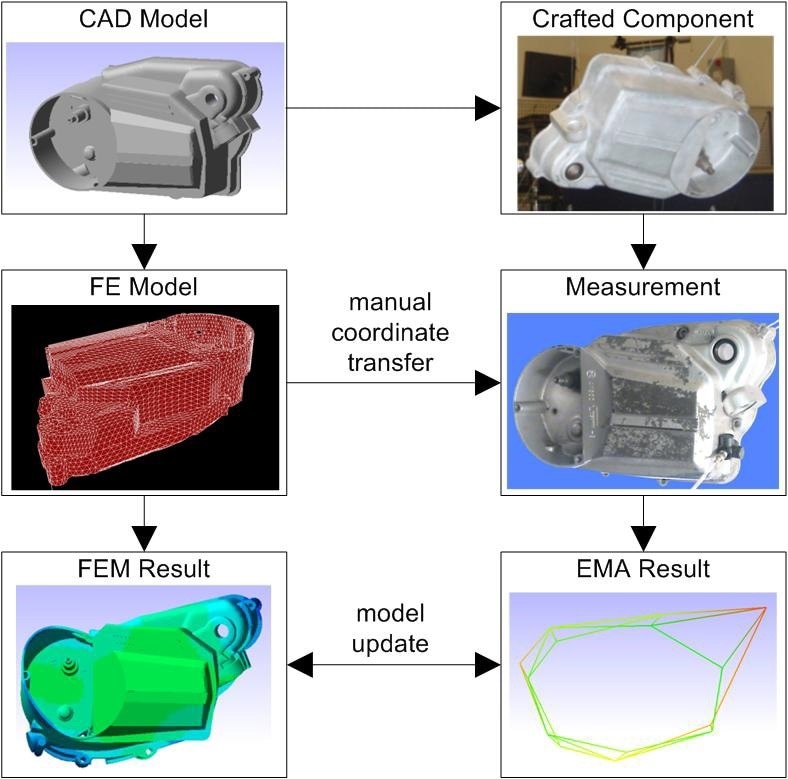
Figure 8. FE model updating process in VMAP with accelerometers.
7.1.2 Automated Test with RoboVib®
- Boundary condition: Free-free
- Excitation: Automated modal hammer with force cell
- Measurement locations: 1630 scan positions / 4890 DOF
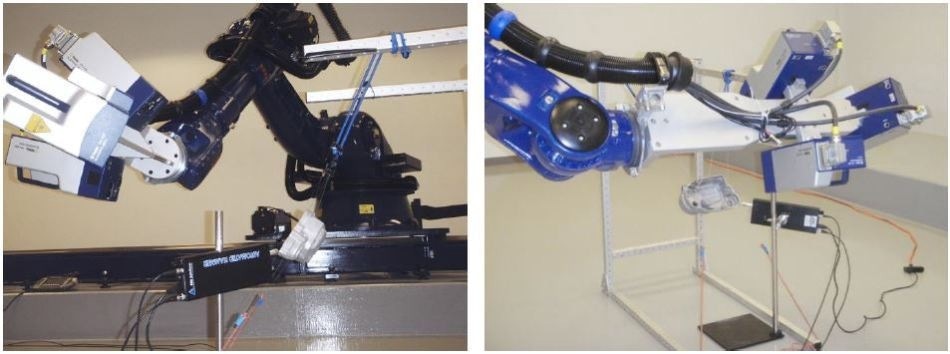
Figure 9. Test Setup with PSV-3D and RoboVib®.
The measurement process is entirely automated. Communications between the measurement software and robot control are delivered over a network through the OPC client/server architecture. The robot delivers a signal when it has traversed to a new location and is ready for the lasers to resume scanning.
The measurement system also sends a signal to the robot when the laser scan has been completed and when the system is ready for the robot to locate to the next position. The diagram in Figure 10 demonstrates the entire CAE-integrated measurement workflow from test structure set-up and preparation through to the update of the FE model.
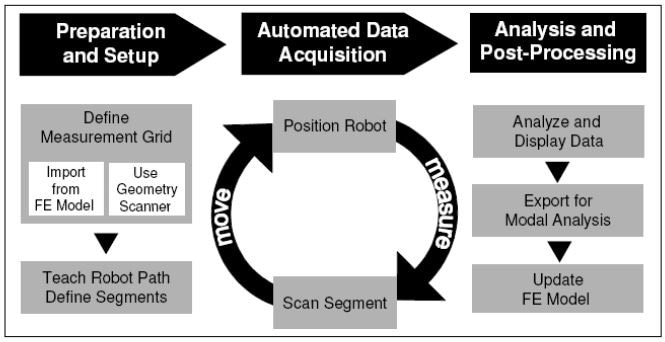
Figure 10. Robot-based SLDV workflow diagram.
The robot was taught with positions from every side of the cover in order to optically scan the whole cover. After the measurement was prepared in the daytime, the measurement was running overnight.
Data from 1630 nodes was automatically collected. Results from all robot positions are automatically merged together into one seamless file for analysis. The post-processing is carried out in the VMAP Modal Analysis package.
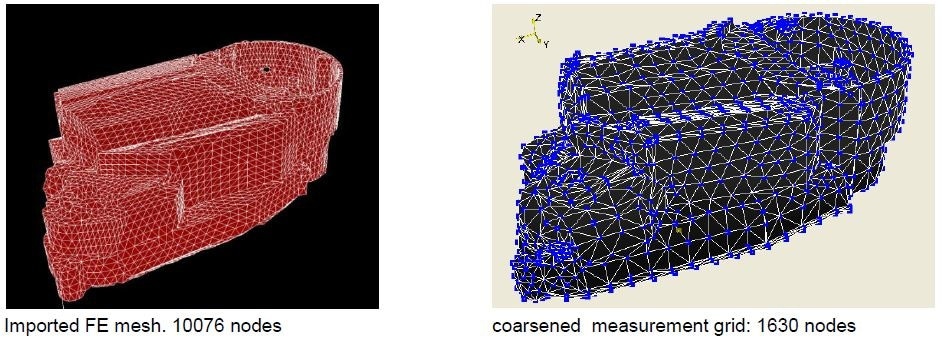
Figure 11. Imported and coarsened FE mesh.
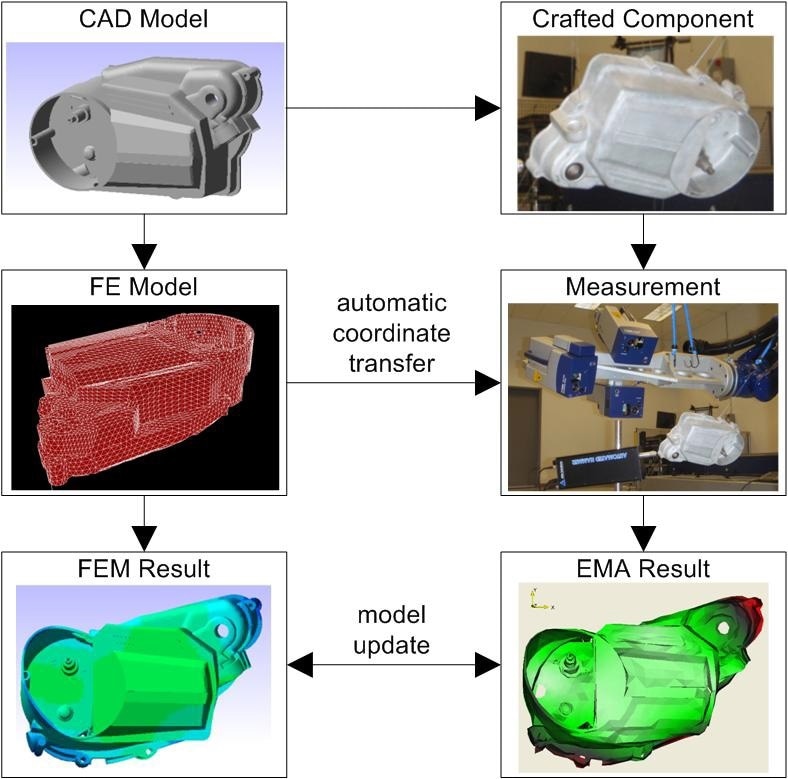
Figure 12. FE model updating process in VMAP with PSV-3D and RoboVib®.
The results of the first two modes for both measurement methods are presented in Figure 13. As reference, the initial two modes from FEA are also shown in Figure 13.
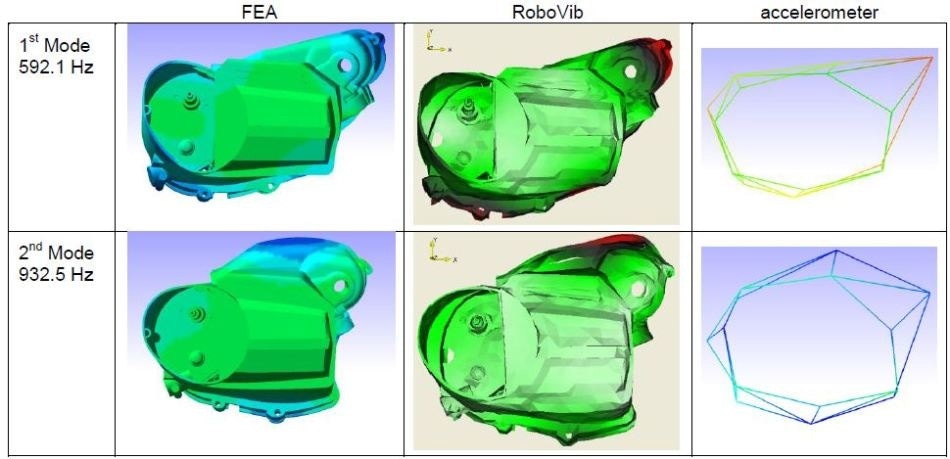
Figure 13. A comparison of mode shapes of FEA with RoboVib® and traditional measurements.
8. MAC Analysis
One key application of the system is the ability to update and compare finite element models (FEM).
For this, full spectral data files for all measurement points can be exported to an experimental modal analysis program using Universal File Format data transfer where modal parameters (eigenfrequencies, natural mode shapes, and modal damping) can be calculated from the analyzed transfer functions.
In this example, the modal analysis program VMAP from TechPassion was employed. It provides a native import of Polytec’s binary file format, without the need for prior conversion into a Universal File Format. Examples like this can be located in [5, 6].
Eigenfrequencies and mode shapes can be compared to the values determined from the simulation and the modal damping can be added to the FEM. The FEM can then be tuned to the real structure and an enhanced model can be derived utilizing VMAP FE model updating tools.
8.1 Accelerometer Test
A modal analysis from the traditional accelerometer test was restricted to the first two modes at 592 Hz and 933 Hz. The MAC values obtained between the same modes from simulation and measurement were 0.67 and 0.59.
These values lead us to conclude that some parameters of the test, for example accelerometer masses and the orientation and location of the sensors, have reduced measurement quality.
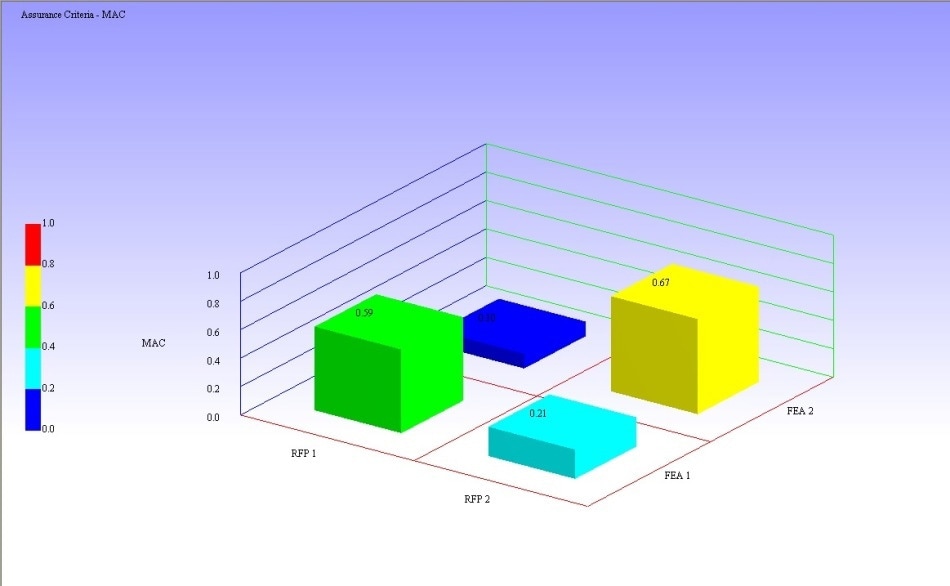
Figure 14. Modal Assurance Criterion (MAC) in VMAP comparing triaxial and FEA accelerometer measurements.
8.2 RoboVib® Test
A 100 times higher point density enables higher modes of the gearbox cover to be extracted. The MAC values between the same modes from simulation and measurement are close to 1, providing a much better match with FEM compared to the accelerometer test.
Figure 15 demonstrates the MAC matrix for the first five modes. The diagonal values are close to 1 and the off-diagonal values are close to zero which provides clear association of the measured modes with the simulated modes.
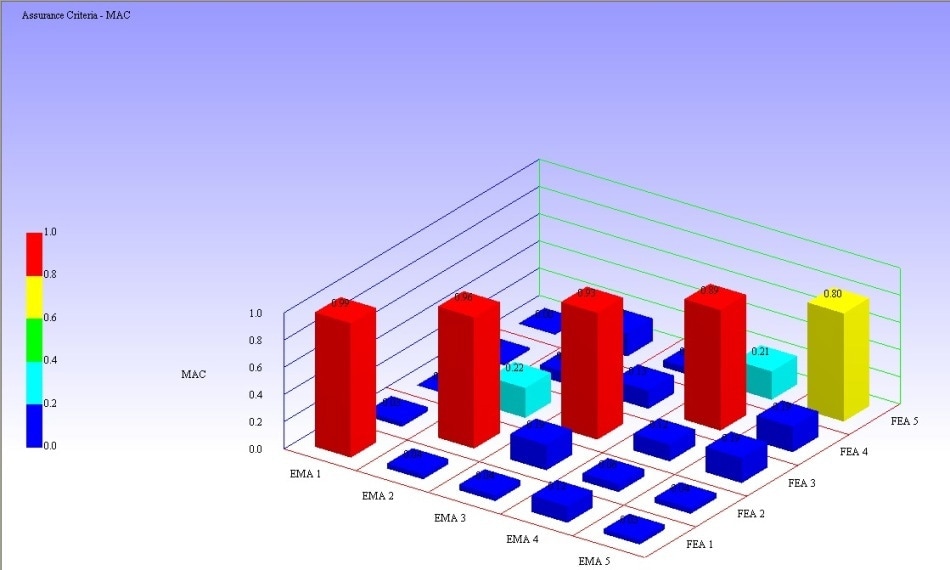
Figure 15. Modal Assurance Criterion (MAC) in VMAP comparing RoboVib and FEA measurements.
9. Summary and Conclusions
As previously stated, measurements with the robot-based system outlined in this article ensure that the measurement grids accurately correlate to the FEM grids and enable automatically generated FEM coordinates to assign the measurement points with ease. This technique removes a degree of complication and enhances productivity.
The updating of the model can be faster, more precise, and more efficient. It can be presumed that even if you can ignore errors associated with sensor masses, the values from the RoboVib test will provide higher MAC values because of the reduction of additional sources of error like the orientation and geometrical match of the results to the nodal points.
Incompleteness ratio is the ratio of FEA nodes and the number of measurement data points. The finite element model generating the update of algorithms perform best with a high incompleteness ratio. In other words, it is critical to utilize as many measurement points as possible. However, this process is time-consuming.
The new RoboVib® scanning laser Doppler vibration measurement system described in this article allows for one or two orders of magnitude higher point numbers, and as such, gives optimal accuracy and productivity in the FEA-Test correlation and model updating activity.
References and Further Reading
[1] B. Stoffregen, A. Felske, Scanning Laser Doppler Analysis System, SAE Paper No. 850327, 1985.
[2] H. Grafe, Model Updating of Large Structural Dynamics Models Using Measured Response Functions, A thesis submitted to the University of London for the degree of Doctor of Philosophy, 1998.
[3] Xu, Y., Miles, R. N.: An Identification Algorithm for Directing the Measurement Point of Scanning Laser Vibrometers, Optics and Lasers in Engineering 22 (1995) 105-120
[4] Schüssler, M., Wörtge, M.: Survey of excitation signals, with respect to scanning vibrometer measurements, Third International Conference on Vibration Measurements by Laser Techniques: Advances and Applications, SPIE Vol. 3411, pp. 386-393, 1998
[5] Bouteille, F., Schüssler, M.: MIMO-testing on a car body using a three-dimensional scanning vibrometer, Proceedings of the ISMA2006 International Conference on Noise and Vibration Engineering, Leuven, Belgium, pp. 3157 – 3163
[6] Schell, J., Schüssler, M., Johansmann, M., Oliver, D., Palan, V.: Three Dimensional Vibration Testing in Automotive Applications Utilizing a New Non-Contact Scanning Method, Society of Automotive Engineers, 2006- 01-1095

This information has been sourced, reviewed and adapted from materials provided by Polytec.
For more information on this source, please visit Polytec.